Events query
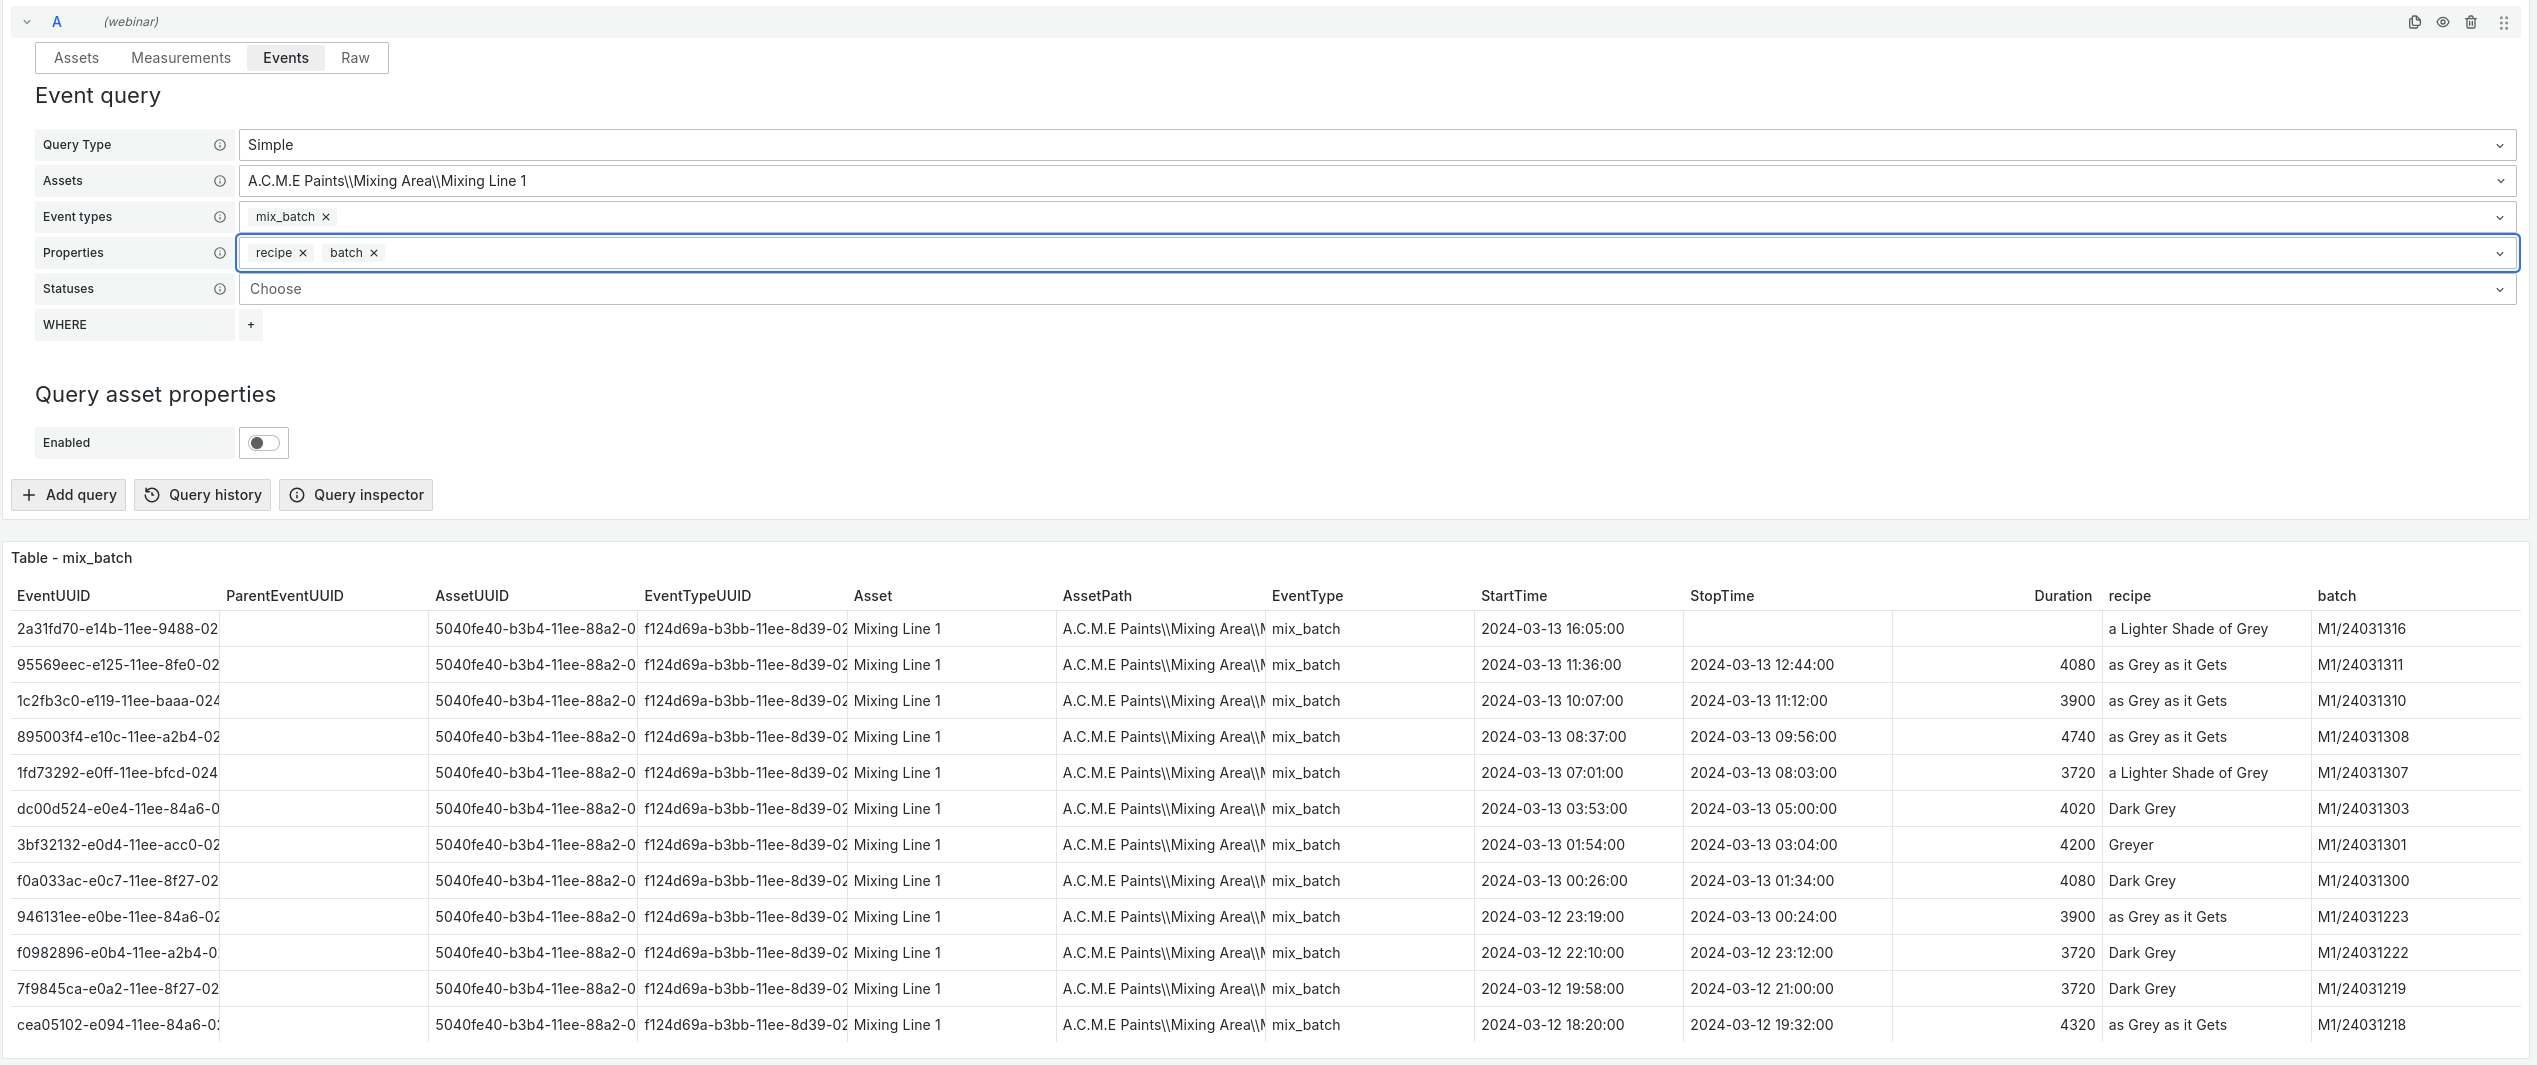
This query type is used to query events and their event properties. Optionally asset properties linked to the asset of an event can also be queried.
Configuring the query

Select a query type
The selected query type determines if simple or periodic events are queried and as a consequence in what format the data is returned.
For simple event queries the data is returned in a table format with each row representing an event .
For periodic event queries the data is best suited for a
trend panel
, each periodic property is a separate series with other event information being included as labels.
Asset selection
There are a couple of ways to select the assets:
- Choose one asset from the cascader menu
- Enter a regular expression (must be surrounded by /)
- Use a dashboard variable
Event type selection
Select the event type(s) for which you want to see the events. The event types available in the dropdown will be the event types that are configured on one of the selected assets.
A dashboard variable can also be used.
Event properties selection
Select the event properties you want to be included in the data, depending on the selected query type, simple or periodic properties will be available.
A dashboard variable can also be used.
Event status selection
By default the events are not filtered by their status, you can select one or more event statuses to include.
A dashboard variable can also be used.
Asset property filter
The events can be filtered by the values of their simple properties.
- Select a property
- Select a comparison operator (=, !=, <, <=, >, =>)
- If filtering multiple properties select a logical operator (AND, OR)
Query asset properties
If enabled, you can query asset properties on the selected asset(s), like you would do for an assets query .
Asset property selection
All the unique asset properties for the selected asset(s) will be available, to select them:
- Select the desired asset properties from the dropdown menu
- Use a dashboard variable
Aggregation options
All of the aggregation options options can also be controlled with a dashboard variable.
Aggregation
- Select one of the available aggregations, or clear the field for raw data
- Select the aggregation period
- Optionally select a fill type
Group by (only for periodic queries)
Select which time series tags to group the series by, by default status is filled in here.
Filter tags (only for periodic queries)
Build the tag filter, by default only data with status = Good is queried.
Limitations:
- Only the
=operator is available - Only
ANDis available when you have multiple tag filters
Limit (only for periodic queries)
The maximum amount of returned data points per series.
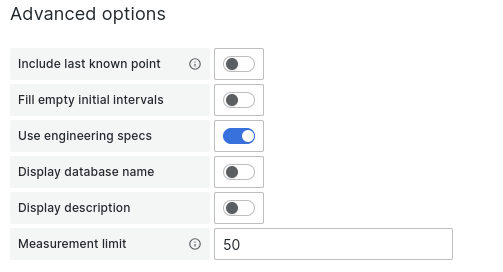
Advanced options

Include last known point (only for periodic queries)
This gives the last point before the time range of the query for the series with the status = Good, and the other tags that are filtered upon.
If another status is in the current time window, the last value for that status will be fetched too.
Fill empty initial intervals (only for periodic queries)
Uses the last known point to fill any initial empty intervals before the first data point in the series.
Does not include the actual last known point in the data, unless Include last known point is enabled too.
Use engineering specs (only for periodic queries)
Uses the configured engineering specs (like UoM) for the measurement linked to the asset property.
Display database name (only for periodic queries)
Includes the database name for the the measurement linked to the asset property in the label.
Display description (only for periodic queries)
Includes the description for the the measurement linked to the asset property in the label (if one is available).
Measurement limit (only for periodic queries)
Limits the amount of measurements queried.
Beware: measurements with no points in the configured interval also count towards the limit. These measurements are not visible, making it seem like less measurements than configured were queried.