1. Folders and dashboards overview
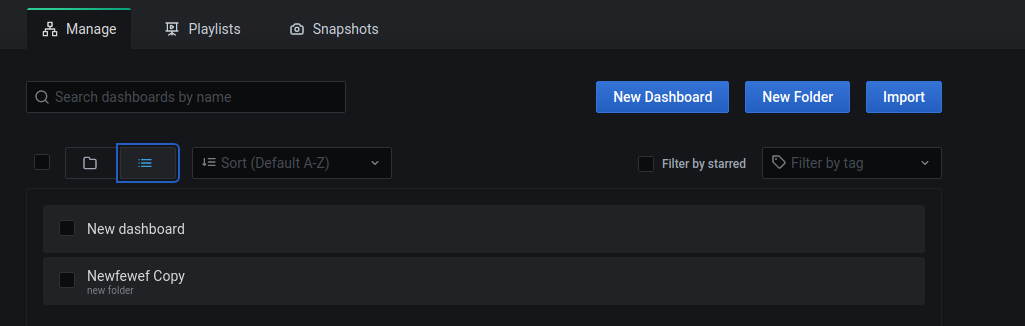
All the dashboard that were setup earlier, can be found in an overview, via clicking the Tiles icon in the grafana main left navigation bar and clicking the Manage icon in the window that pops up.
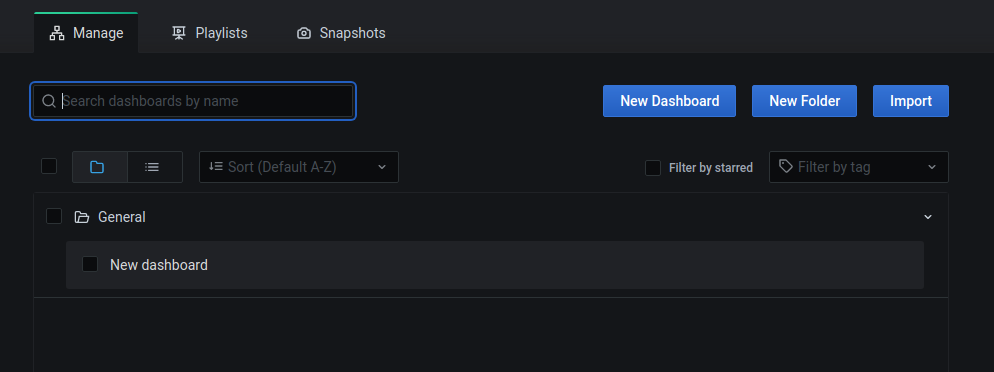
Here a folder structure can be setup, holding a tree of folders containing dashboards. In this way, you are able to structure your dashboards more conveniently.
An example of a folder is the General folder holding the New dashboard as can be seen in the image above.
2. Manage folders
Folders can be managed in their naming and the permissions a user needs to have to be able to access the folders contents.
2.1 Adding a folder
Click the New folder button in blue in the top right to start adding a new folder.
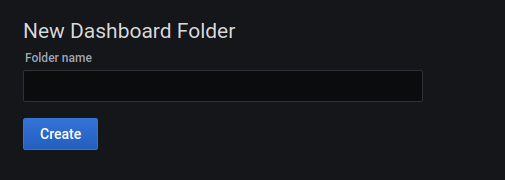
Fill in a folder name in the Folder name entry followed by a click on the Create button in blue to create the folder and make it visible in the Manage dashboards overview .
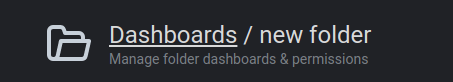
By default after creating a folder, you will be redirected into the new folder instead of in the manage dashboard overview.
This can be confusing behaviour of grafana and can be noticed on top in the path that is indicated there.
In general, it is good practice to make a folder with your name or team. to put some trial dashboard into that folder.
In this way everyone of the organization knows these are dashboard you want to manipulate on your own.
In a similar fashion, a Factry folder is generally created for dashboards made by the factry team.
2.2 Folder tree
As explained above, in the Manage dashboards overview the folder tree can be seen.
Up till now, it is not possible to have a folder tree of more than 1 level. This means you can not make subfolders into a parent folder.
As a result, all folders in the overview are only one drilldown level deep.
Show and hide folder content
In the Manage dashboards overview you are able to show and hide the content.
To toggle the show and hide of the folder content, click on:
- either the
folder icon - either the
folder name - either the
arrow iconon the right of a folder

Open up a folder
To open a folder, click on the Gear icon that pops up when hovering the mouse over a folder.
By default this opens up an overview of the dashboards which are located in this folder.
This is confusing, since the gear icon normally should open up the folder settings directly.
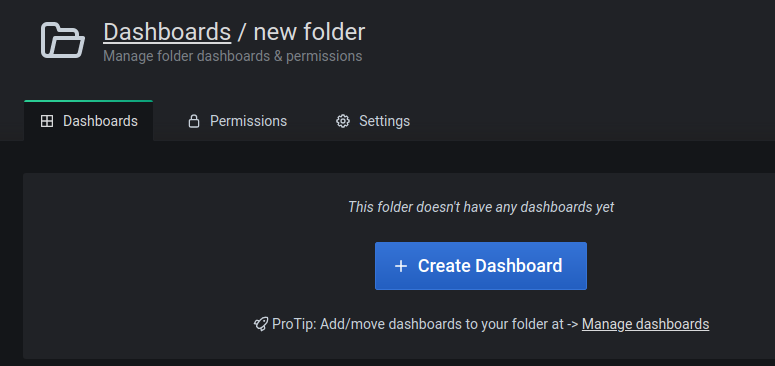
Once a folder is opened. you can add a dashboard directly to this folder by clicking the Create dashboard button in blue .
Return to manage dashboards
Once a folder is opened, a shortcut for going back to the folder tree, is by clicking the Dashboards text in the folder path.
Else, you can access the Manage dashboards overview again by hovering over the Tiles icon in the grafana main navigation bar on the left and clicking the Manage dashboards in the popup window.
2.3 Delete a folder
To delete a folder from the Manage dashboards overview, click the gear icon when hovering over a folder with the mouse.
Then click the Settings tab on top, followed by a click on the Delete buton in red .
When deleting a folder, all content of the folder (all dashboards) will be deleted with the folder. Make sure to check the content of a folder first before deleting it.
3. Manage dashboards
3.1 Dashboard list
There is the possibility to view all dashboards at once, which are located in different folders.
In this way, you can use the folder structure to organize folders, but undo the folder tree view when trying to look for a specific dashboard.
To undo the folder tree, to view all dashboards at once, click the List view icon on top.
Note that the folder names are indicated in grey underneath the name of the dashboard in the list.
To go back to the folder tree, click the folder icon on top.
The folder tree structure is not removed, when viewing all dashboards in one list.
Sort dashboards
Once the dashboards are located inside one list, they can be sort in 2 ways:
- Select
A-Zin the dropdown on top next to theList view iconto sort the dashboards alphabetically - Select
Z-Ain the dropdown on top next to theList view iconto sort the dashboards reverse alphabetically
3.2 Favorite dashboards
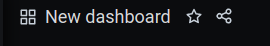
Dashboards can be set as favorite by starring them.
This is done, by opening up a dashboard and clicking the Star icon next to the dashboard name.
Only one of the starred dashboards can be set as the home dashboard in the grafana configuration preferences.
Filter by starred
In the dashboard list view it can be useful to filter for dashboards, which have been starred.
To do this. enable the Filter by starred checkmark on top.
Home dashboard
A dashboard can be picked as the Home dashboard , meaning this dashboard will be opened by default when browsing to grafana.
Set one of the favorite dashboards (only starred ones) as your home dashboard by hovering over the Gear icon in the grafana main navigation bar on the left and clicking Preferences .
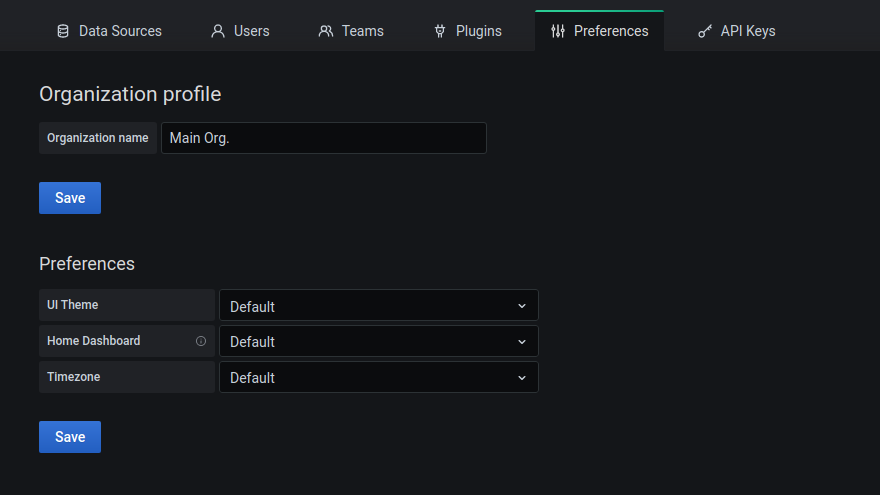
Pick the dashboard you want to set as home dashboard, by selecting it in the Home dashboard dropdown .
This home dashboard will be applied for the current grafana organization, the user is logged on.
3.3 Search dashboards
Search for a dashboard over all folders by filling in the dashboard name or the first part of it, in the Magnifier icon entry on top.
3.4 Dashboard version control
Grafana has a version control system for dashboards built-in. This means that saved changes on dashboards are tracked, as versions, accompanied with a optional note when saving the dashboard. Afterwards, a dashboard can be restored to previous version conveniently to undo changes that have been made earlier.
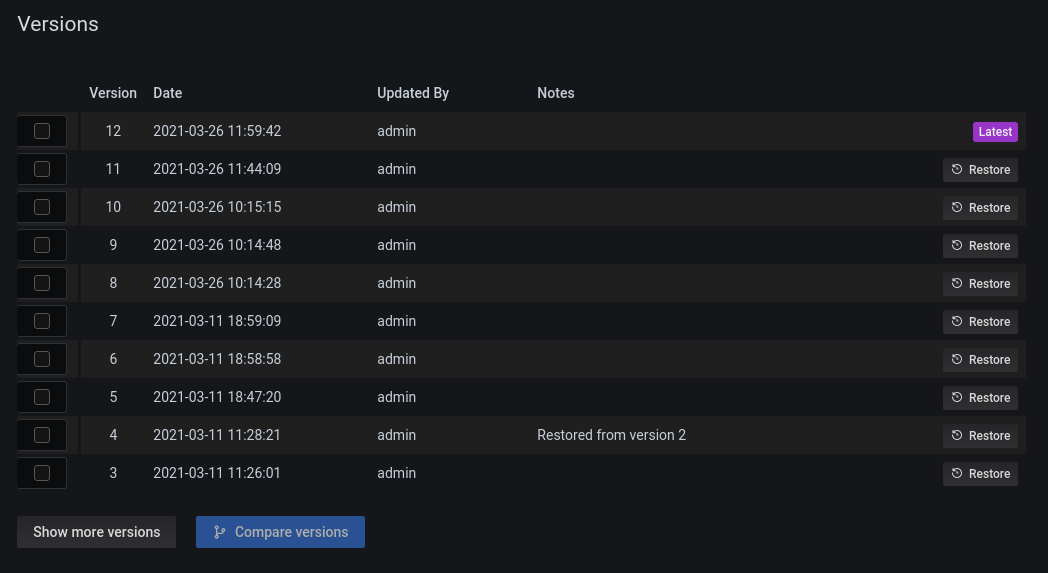
Dashboard versions
To checkout dashboard versions, go into a dashboard, go to the dashboard settings with the Gear icon on top and click the Versions section.
Here an overview of all saved changes can be seen, each coupled onto a separate dashboard version.
Since there is version control available in grafana, there is no need to start numbering dashboards in the dashboard name because of making a new version for it. Although taking a copy of a dashboard could be useful when you want to try something out wile others keep using the original dashboard.
Restore a previous dashboard version
To restore a previous dashboard version, click the Restore button on the right of a previous dashboard version.
To see all dashboard versions, instead of just the last ones, click the Show more versions button at the bottom.
Compare version changes
You can compare version by selecting 2 version to compare by selecting the checkbox next to the versions and clicking the Compare versions button in blue at the bottom.
A window will popup, telling you which entities have been changed in the dashboard between the 2 selected version.
If you can’t find where the saved change that you want to omit happened, just restore one version a time and checkout the dashboard between version restores.
3.5 Moving dashboards
Via the Tiles icon in the main grafana navigation bar on the left, click Manage dashboards to go to the overview of dashboards.
You can select dashboards by clicking the Checkbox next to the dashboard line.
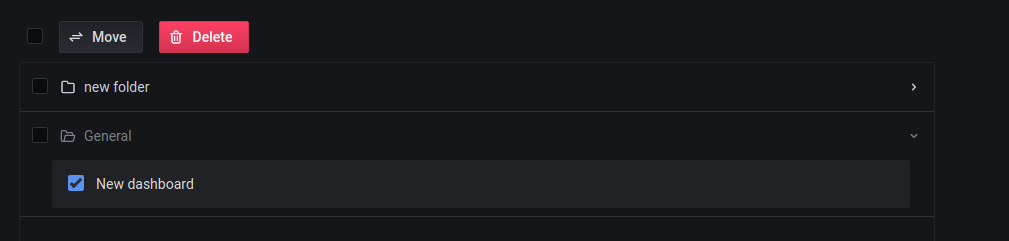
After selecting a dashboard, you are able to move the dashboard into another folder, by clicking the Move button that appeared on top.
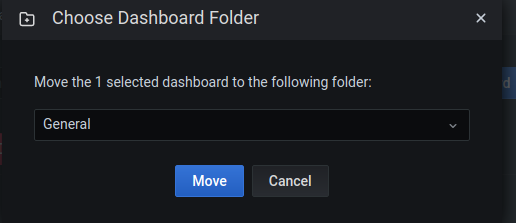
In the Folder dropdown in the popup window, select the folder in which you want the dashboard to be stored, followed by a click on the Move button in blue .
Next to moving the dashboard, you can also take a hard copy of a dashboard.
4. Manage permissions
Permissions can be managed in grafana on 4 different levels:
User roleTeam permissionsDashboard permissionsFolder permissions
4.1 Users
Fundamental before setting permissions on team level, folders or dashboards, you need to add users to grafana and give them a grafana role.
Overview of users
Hover over the Gear icon in the main left navigation bar of grafana and click Users .
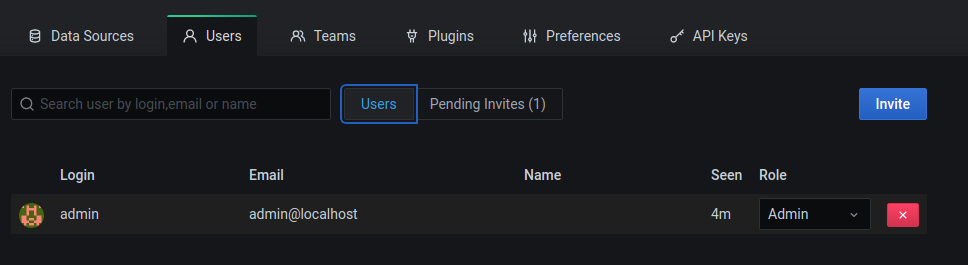
Here a list of current users in the organization can be found.
By default, only an admin user is present.
User roles
In grafana there are 3 types of users possible:
- an
Adminrole → by default can adjust all settings for the organization, editing and viewing dashboards, setting permissions, … - an
Editorrole → by default can adjust dashboards, edit basic settings for the organization - a
Viewerrole → by default can only view dashboards
Adding users
To add a user, click the Invite button in blue in the top right.
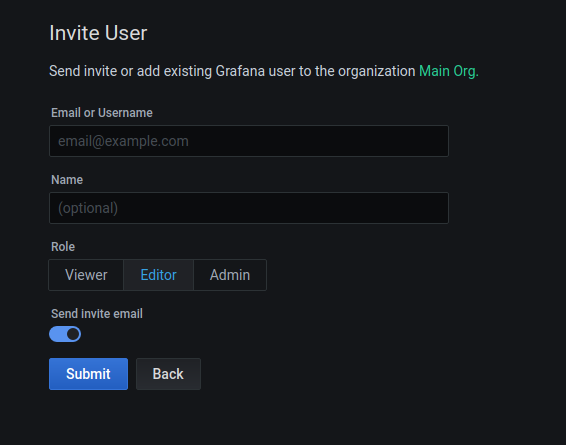
Fill in the Email address and the Name for the new user.
Give the user the according Role .
Enable the Send invite email slider if the email server is configured into the grafana configuration, else the email will not be able to be send to the new added user.
In that case, disable the Send invite email slider . You will be able to manually send an email with the according login link later on.
Click on the Submit button in blue to add the user to the organization.
Pending invites
Once a user was added to the organization, the user won’t appear immediately in the list of active users.
First the invited user should confirm and setup his password via the mail he received, before the user will appear in the user list.
If the invite email was never send, in case the slider was disabled (see above), then the link can be manually send.
See the list of Pending invites by clicking the Pending invites button .
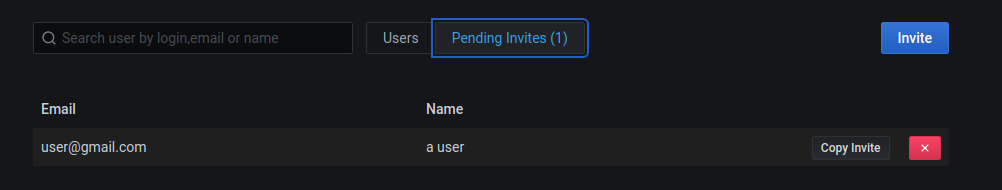
Click the Copy invite button and paste this link into an email to be received by the newly added user.
You can also undo the Pending invite by clicking the Red cross icon in red next to the according pending invite.
Removing users
Go to the list of users via the Gear icon in the main left navigation bar of grafana and click Users . To remove a user, click the Cross icon in red next to the user you want to remove.
Changing a users role
Checkout the list of users via the Gear icon in the main left navigation bar of grafana and click Users . To change the role of a grafana user click the Role dropdown and select the according new role for the user.
4.2 Team permissions
To make access control more convenient in use, teams can be set up to manage permissions on a team level instead of setting permissions user per user.
Add a team
Go to the teams overview, via hovering over the Gear icon in the grafana main navigation bar on the left and click on the Teams icon .
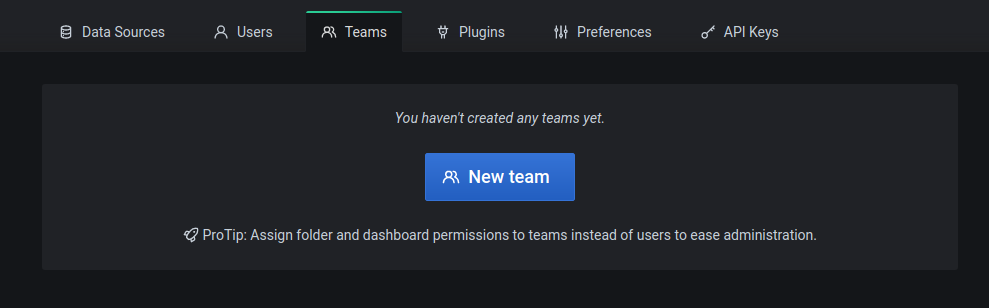
Press the New team button in blue to start adding a new team to grafana.
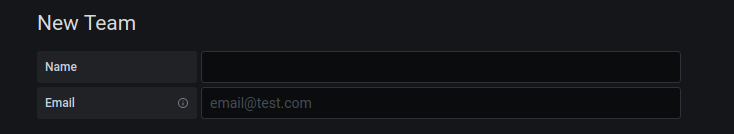
Fill in a Name for the team in the Name entry .
Leave the Email entry empty.
Add users to the team
After adding a team or clicking on a team, a new window pops up.
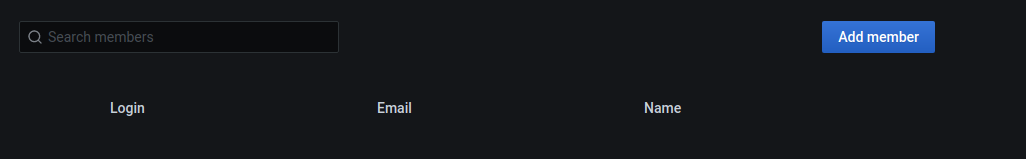
Click the Add member button in blue on the top right to start adding users to the team.
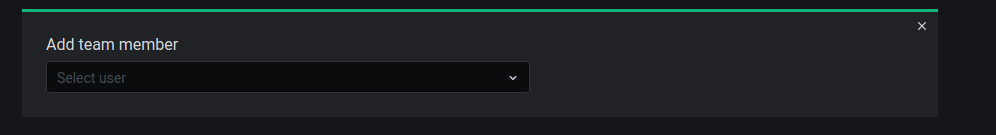
Click the Add team member dropdown to start adding users to the team.
After selecting a user, click the Add to team buton in blue to add the user to the team.
Repeat this process for all users you want to add to the team.
Delete a team
To delete a team, go to the teams overview via hovering over the Gear icon in the grafana main navigation bar on the left and clicking the Teams icon . Click the Cross icon in red next to a team line and confirm with clicking the Delete button in red that pops up to remove the according team.
Removing a team from grafana is not going to delete all users present in the team from grafana,
4.3 Dashboard permissions
Next to user roles and team access control, permissions can be set onto a dashboard so that only certain users can access the dashboard or edit it.
To set the permissions on a dashboard level, go into the according dashboard and click the Gear icon on top, followed by a click on Permissions on the left side.
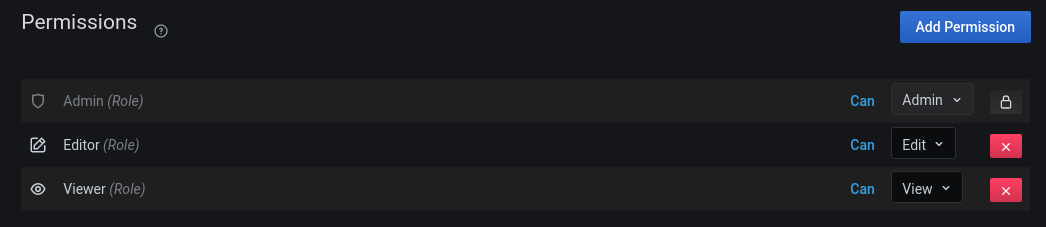
By default, for each role a permission can be set and altered, meaning only grafana users with the Viewer role can not edit the dashboards content.
Change a permission
Change the permission for a grafana role for this dashboard by selection another permission in the dropdown on the right of the permission rule.
Delete a permission
Delete a permission, by clicking the Red cross icon on the right of a permission rule.
Add a permission
Add a permission, by clicking the Add permission button in blue in the top right.
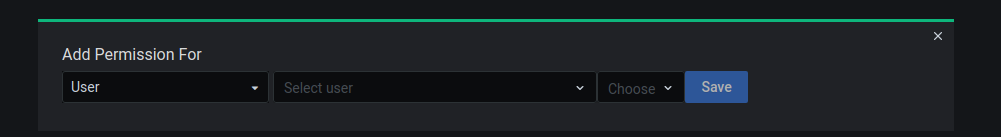
In the left dropdown on the left, the type of permission can be set to:
- User level
- Team level
- Grafana roles
The grafana roles can be selected, to overwrite the default permission for this role to another permission specifically for this dashboard. F.e. a user with a grafana Viewer role can be given the permission Edit to have the ability to edit only this dashboard.
In the middle dropdown a specific User or a specific Team can be selected.
In the right dropdown the according permission can be set.
Click the Save buton in blue to save the permission for the current folder.
When a permission needs to be set on multiple users or teams, you need to set separate permission lines per user or per team.
Note that it is convenient to add multiple users to a team, to set permission on team level.
4.4 Folder permissions
Next to dashboard access control, permissions can be set onto a folder level.
Manage folder permissions
To be able to manage folder permissions, go to the Manage dashboards via the Tiles icon in the main grafana navigation bar on the left.
Click the Gear icon when hovering over a folder and click the Permissions tab in the new screen.
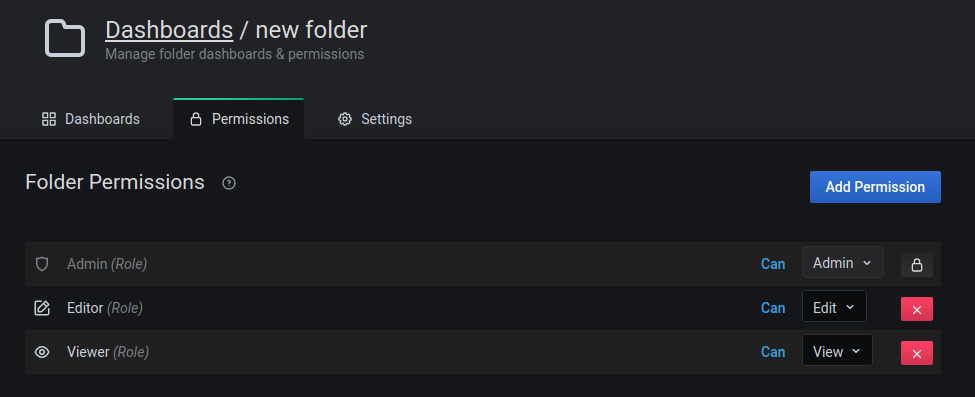
Further, changing, deleting and adding permissions on a dashboard level is similar to setting permissions on a folder level (see above).
Multiple permission layers
Note that setting permissions on a dashboard level is more fine-grained access control than using folder permissions. Therefore in most cases, folder permissions are set not as restrictive as the dashboard permissions for dashboards included in the folder.
Both folder and dashboard permissions can be used in combination. In that case, use broader permissions on the folder level than on the dashboard level to make good use of the access control.
Personal folders
As explained above (for adding folders), it could be useful to have a folder named to a user or a team. In that way it is clear that dashboards inside this folder are meant to be changed only by the user or team owning the folder.
To be completely sure that a user or team are the only ones with the ability to change the dashboards inside a folder, you can restrict edit access to only a team or a specific user. Remove all other present Edit rules for this to take effect.
Once a dashboard inside this folder should be able to be edited by other users as well, you can copy the dashboard to another folder without restrictive permissions.
Make sure to indicate the new folder when Saving as the dashboard to take a hard copy.