1. Stat as panel
1.1 About a Stat
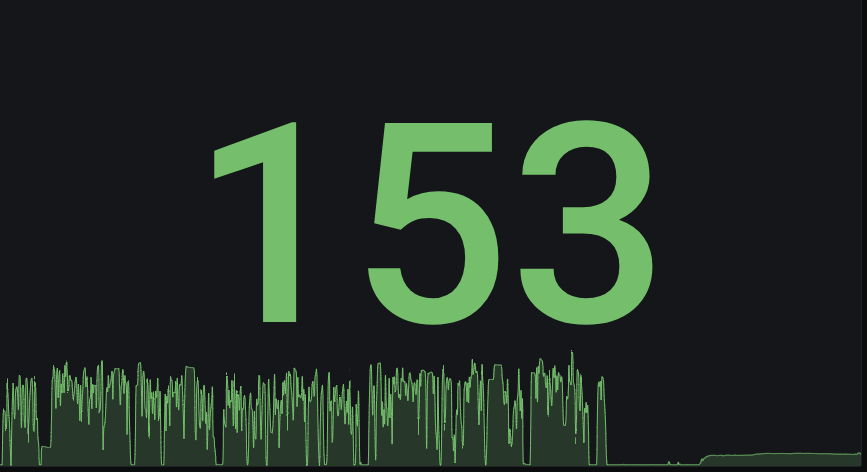
A stat is used frequently to highlight one key number derived from the incoming data steam of one of the measurements.
An aggregate of the data stream within the selected time range can be chosen f.e.:
- an average
- a mean
- a count
- …
1.2 Setup a Stat
Get into a dashboard panel.
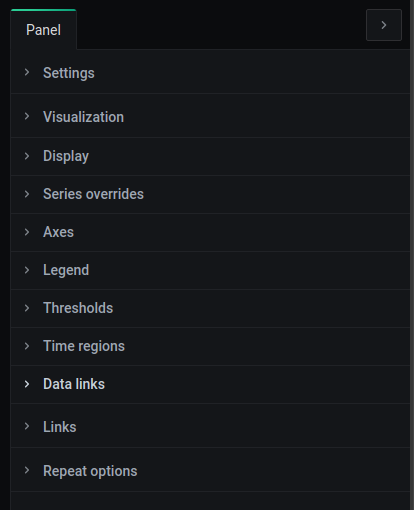
In the panel right pane, the panel can be configured.
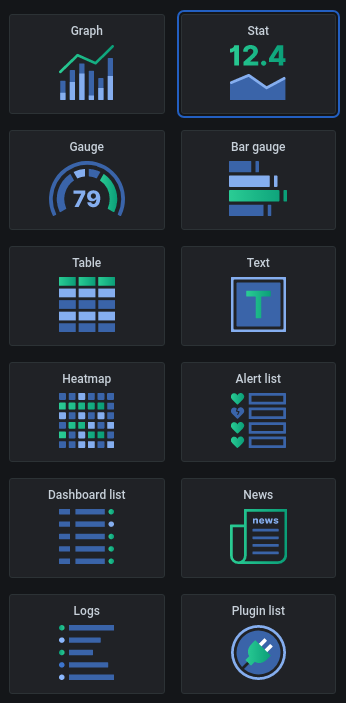
In the Panel visualization tab , the panel type can be selected as a Stat by clicking the Stat.
2. Stat display settings
Click the Display dropdown in the right pane of the panel to open the display settings.
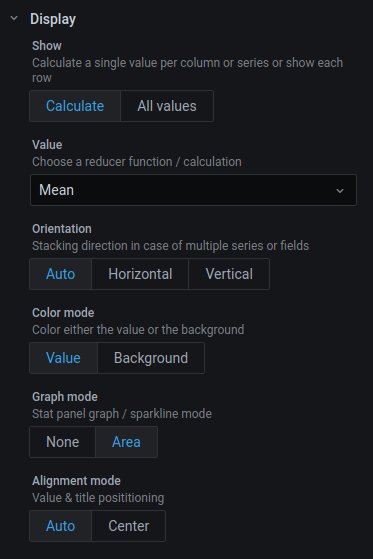
In the Stat display settings, some general display properties can be changed.
2.1 Reduce to one key value
The stat function is almost exclusively used to reduce the values in the data stream to one key value.
Therefore you need to select the Calculate colored box underneath the Show section.
Further, select the according reduce operation underneath the Value section by clicking the Mean dropdown .
Most of the time a selector or an aggregate is used for a stat, but other options are available.
Selector
The following selectors can be indicated as a reduce operator:
-
Last
to extract the last value of the measurement in the current time range -
Last (not null)
to extract the last value of the measurement, that is not null
meaning the last non-empty value will be highlighted -
First
to extract the first value of the measurement in the current time range -
First (not null)
to extract the first value of the measurement, that is not null
meaning the first non-empty value will be highlighted -
Min
extract the minimum value (not null) in the current time range -
Max
extract the maximum value (not null) in the current time range
Aggregate
The following aggregates can be indicated as a reduce operation:
Mean
to calculate the mean of the measurement values in the current time rangeTotal
to calculate the sum of the measurement values in the current time range
Count
Count
to count the number of measurement values in the current time rangeChange count
to count the number of measurement values that are different compared to the previous value in the current time rangeDistinct count
to count the number of unique measurement values in the current time range
Range
A range can be chosen as key measurement:
Range
to get the range between the minimum and the maximum value of the measurement in the current time rangeDifference
to get the range between the first and the last value of the measurement in the current time range
Boolean
A boolean can be set as the key value (true or false):
All Zeros
to check if all measurement values are zero in the current time range → true
if a single value is existent in the current time range → falseAll Nulls
to check if all measurement values are null in the current time range (so no values) → true
if a single value is existent in the current time range → false
2.2 Layout
Some basics layout settings can be altered in the Display settings .
Color mode
One can choose if configured colors should apply to the value itself or if the configured colors should apply onto the background, using the Color mode colored box .
- enable
Valueto apply colors on the value - enable
Backgroundto apply colors on the background of the Stat
Background graph
Since the Stat highlights one single key value, the graph holding all measurement values in the current time range can be of non importance.
By default this graph is still displayed in the background of the Stat.
To disable the graph, set the Graph mode colored box to None instead of to Graph .
3. Stat configuration
Some basic settings for the Stat can be altered by clicking the Field tab on the top right and unfolding the Standard options dropdown by clicking it.
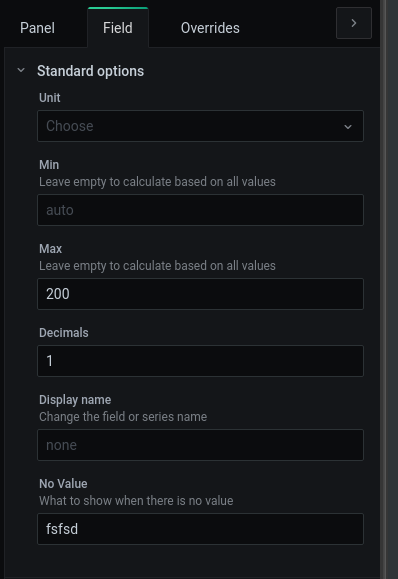
3.1 Units
As with the graph, a unit can be configured to be displayed next to the highlighted key value in the stat.
3.2 Range
The range for the measurement values displayed in the background graph of the Stat can be set.
Visually, this will constrain the values of the background graph.
This range is also used for setting the Stat thresholds later on.
The minimum and the maximum value for the measurement values can be indicated:
- fill in a number in the
Min entryto set a minimum value - fill in a number in the
Max entryto set a maximum value
This range does not visually apply on the key value that is highlighted by the Stat.
3.3 Decimals
The number of decimals to be displayed in the key value for the stat can be set in the Decimals entry .
By default no decimals are shown, even if decimals are present in the raw data contained in the influx database.
3.4 Display name
A display name can be set, to be shown above the key value of the Stat.
The display name for the stat is not the same as the panel title.
Most of the time, an according panel title is set and the display name is left empty.
3.5 Empty key value
If the key value derived from the reduce operation is empty (null), then another value can be displayed in it’s place by setting the No value entry .
It could be useful to display a small text here like “No value”. Else for no value, the key value won’t be displayed at all.
3.6 Base color
For a Stat, the base color can be set, applying onto the key value highlighted by the Stat and the background graph (if visible).
Click the Thresholds dropdown in the right pane to unfold the Thresholds section .
Click the colored circle icon next to the Base box to open the color editor. This is a similar color editor as discussed when adding a graph as a panel (check for more information).
After selecting a color, this color is used to display the key value and the background graph for your Stat.
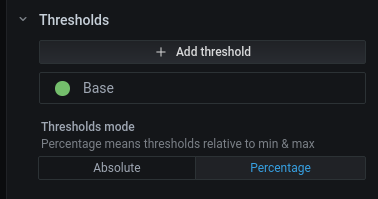
3.7 Thresholds
Thresholds can be added, applying onto the key value highlighted by the Stat.
Click the Add threshold button in the Thresholds section to add a new threshold.
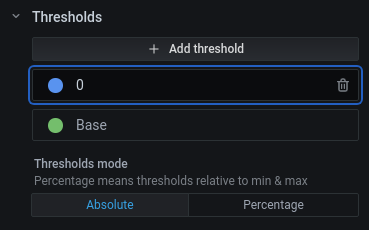
In the Added threshold entry click the zero value and fill in a number to be applied as a threshold onto the key value of the Stat.
Threshold mode
After adding a threshold, you need to specify if the number functions as an absolute value to be compared with the key value or as a percentage pinned onto the indicated Stat range (see above).
- Click the
Absolute colored boxunderneath theThresholds mode sectionto indicate the given number as absolute. - Click the
Percentage colored boxunderneath theThresholds mode sectionto indicate the given number as a percentage compared to the Stat range.
Threshold color
The thresholds are accompanied with a color to be applied onto the key value. Set a color by clicking the colored circle icon and picking a color in the color picker (see above).
The threshold color will be taken for granted, once the key value is higher than the indicated threshold.
Base color
The first entry in the threshold, always indicates the Base color . This is the color that will be used when a value is not higher than the first threshold, or no thresholds are specified.