1. Table as panel
1.1 About a Table
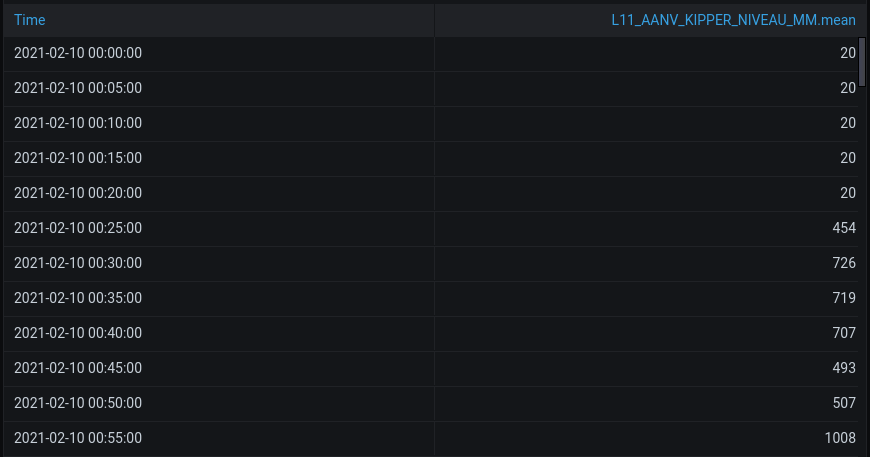
A Table is frequently used to easily get an overview of the data that is present in the current time range.
It can be useful to quickly switch between another panel visualization and a Table, to debug an issue or unexpected behaviour that occurs in the other panel visualization.
1.2 Setup a Table
Get into a dashboard panel.
In the panel right pane, the panel can be configured.

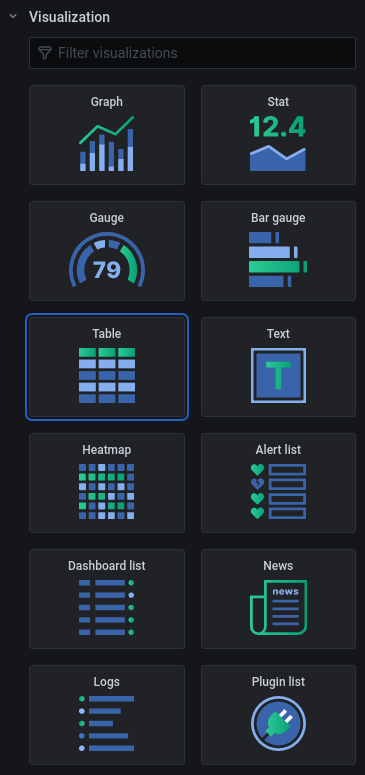
In the Panel visualization dropdown , the panel type can be selected as a Table by clicking the Table.
2. Table display settings
Click the Display dropdown in the right pane of the panel to open the display settings.
In the Table display settings, some general display properties can be changed.
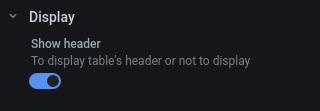
2.1 Table header
In the Table display settings enable the Show header slider to let the header of the table be displayed, holding the column names.
3. Table configuration
By clicking the Field tab in the top right, the table can be configured further.
3.1 Column width
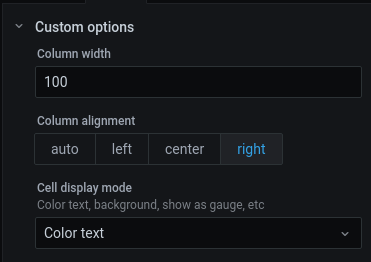
Unfold the Custom options dropdown by clicking it.
All columns
The column width can be set fixed and equal for all columns by filling in the Column width entry .
This can be used as a start point for setting the width of all columns at once.
Single column
You can alter the column width for each column individually by hovering over the table header and dragging the mouse to the left or the right when the double arrow icon appears.
Once the column width is set using this approach this will be used as a default for this panel after a dashboard save,
3.2 Text alignment
All columns
Select the according Colored box underneath the Column alignment section by clicking to be able to set the text alignment in a column to:
- the left
- centered
- to the right
The text alignment will be applied to all columns at once.
3.3 Colored thresholds
All columns
The approach for setting thresholds is identical to the one described for adding a Stat .
[Add a stat]((docs/grafana/add_a_stat)
For the thresholds to apply on the table columns, you need to set the Cell display mode dropdown in the Custom options dropdown .
Since, you are able to color the column values according to the thresholds or color the column background.
- to color the column values according to the thresholds, select the
Color textoption. - to color the column background according to the thresholds, select the
Color backgorundoption.
4. Single column configuration
Note that for most of the above configuration settings for a table, the settings apply immediately to all columns at once. Therefore there is a 3rd tab on the top right, the Overrides tab .
Click the Overrides tab to add overrides for table properties applied to one single column in the table.
4.1 Column override
Add a column override
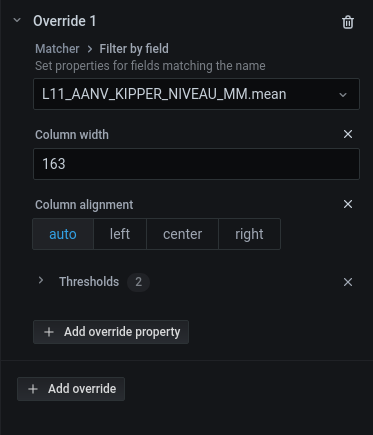
Click the Add override button to add an override for one single column of the table.
A window pops up, click Filter by field .
Click the Choose dropdown and select the according column that appears in a new popup for which you want to start adding override properties.
Each column can have only once an override applied to them.
Remove a column override
To remove a column override that has been added earlier, click the Waste bin icon next to the according column override you want to remove.
If a column override is removed, all the column override properties for this column override are removed as well.
4.2 Column override properties
Add a column override property
In your newly created override, click the Add override property .
In the window that pops up, select the according property you want to set for the override column only.
After selecting an override property, a visual element is added underneath the according override, where the property value can be picked.
Multiple override properties can be added to one override column.
Remove a column override property
To remove a column override property for a column override, click the Cross icon on the right side next to the according column override property you want to remove.
5. Table transformations
Table columns can be arranged using a Transformation in Grafana.
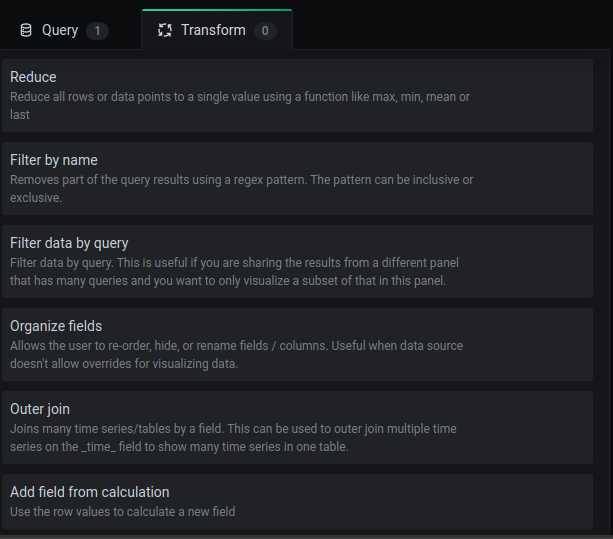
In the left pane, click the Transform tab to open up the available transformations.
5.1 Organize table columns
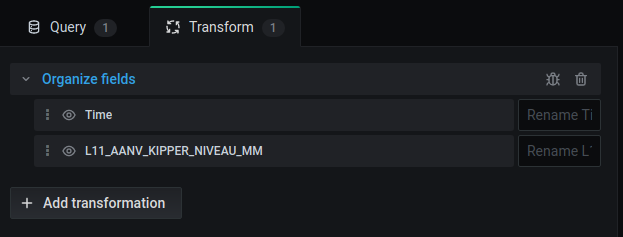
Click the Organize fields box to add Organize fields as a transformation to the table.
Column order
To set the column order in the table, hover over the 3 dots icon next to a column name in the organize fields transformation and drag and drop the box vertically over other boxes to arrange another position for this column in the table.
The box on top is the leftmost column in the table.
Rename a column
Rename a column by filling in the new name in the Rename entry right of a box in the Organize fields section .
Hide a column
Hide a column by clicking the Eye icon on the left of a box in the Organize fields section .
Unhide the column, by clicking the Eye icon another time.
Delete a table organisation
Delete the configured table organization by clicking the Waste bin icon in the top right of the Organize fields section .
5.2 Joining measurements as columns
Query multiple measurements
Joins can only be done when multiple queries are added to the query editor, each fetching data from different measurements accompanied with a timestamp.
Adding multiple queries to the query editor is explained here:
Explore measurements - query data
When multiple queries were added to the panel, by default they are in a separate table, which can be opened using the Table dropdown that appears on the bottom of the table itself.
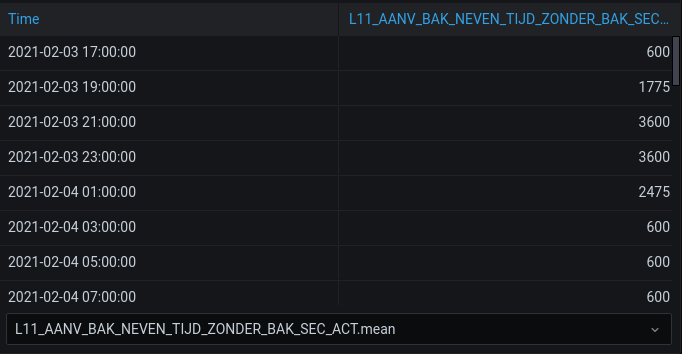
To see the measurement column from the different tables into one table, where each measurement (or field of the same measurement) gets appointed to a different column, the tables need to be joined.
Join multiple measurements into one table
Click the Outer join box in the Transform tab to open up the outer join section.
Click the Field name dropdown and select Time in the popup window for the values of the different tables to be joined based on time.
In almost all cases, the key for the join will be the time column, which makes sense since we are dealing with time series data.
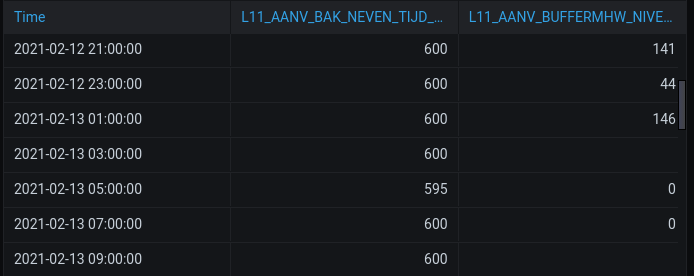
Afterwards, the Table dropdown should disappear and all measurement values should be visible in a separate columns into one table.
If the column values do not align for the same timestamps, check if the measurement values are present for the same timestamp using the graph visualization. There the measurements should be vertically on top of each other for the same indicated timestamps on the x-axis.