1. Alerting in grafana
1.1 About an alert
An alert is a general way of getting notified when your incoming measurement data does not live up to the expectations or if a specific event happens.
Alerts are heavily used to monitor incoming data for different kinds of data sources.
In general it is good practice set them up, if specific events happen on the incoming data, which should otherwise be monitored manually by a person.
The factry team uses them to monitor stopping of incoming data streams for measurements per collector on your site, so no need to set that up yourself.
Simple example
A simple example could be to use an alert in the case of a tank that is filled with some kind of content. Whenever the tank is almost empty, an alert could be notifying the operator quickly after the alert was triggered. This gives the operator the ability to arrange the refill of the tank, without the need to spend time looking at the fill level of the tank.
1.2 Ability to set an alert
In grafana, some constraints are limiting the ability to setup alerts on incoming measurement data streams. The following requirements need to be fulfilled before being able to setup an alert on a dashboard:
- The dashboard panel visualization needs to be a
Graph - The dashboard can not hold dashboard variables
- A query needs to be set on the panel, with live incoming data from a particular measurement
2. Setup a visual alert
To setup an alert, get into a dashboard panel and set the panel visualization as a Graph .
Next, make sure to add a query to fetch data from a measurement with live incoming data.
In a Graph panel, click the Alert tab in the left pane to open up the alert configuration.
This alert is purely visual and can only be noticed when someone is looking at the dashboard where the alert is triggered.
Alternatively, the alert can also be seen using a panel with the alert visualization, which gives by default an overview of all alerts over all dashboards.
2.1 Alert name
It is good practice to set an according alert name, so that your alert is easily recognized later on when multiple alerts will have been set up.
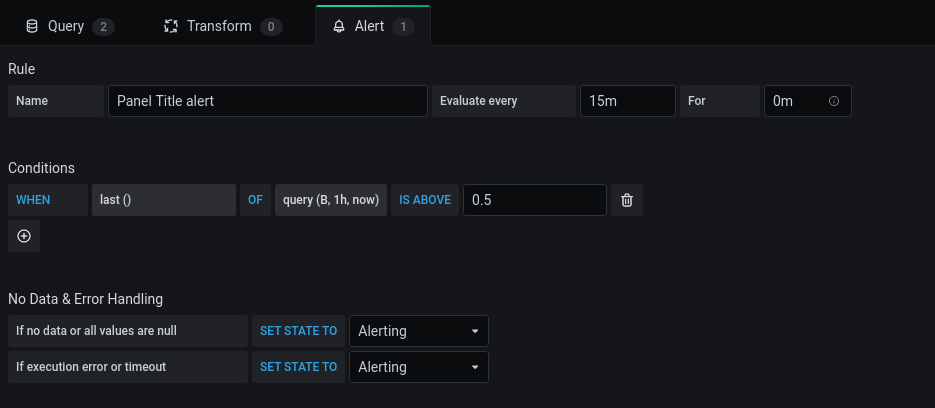
Set a name for the alert by filling in the Name entry . By default this will be the panel title suffixed with the word “alert”.
2.2 Alert evaluation
An important section of the alert is the alert evaluation configuration.
Specify how frequent the alert conditions below need to be evaluated, by filling in the Evaluate every entry :
- s for
seconds - m for
minutes - h for
hours
Do not use the For Entry section, since this will only delay the triggering of the alert, which has never been useful up to this day.
Set the For entry to 0m or leave it blank.
2.3 Alert condition
The most important part of the the alert, are setting the alert conditions.
By default one condition will be present.
First, choose the correct query from the query editor for which the alert should be set. This can be done by clicking the capital letter indicating the query identifier as a 1st argument in the OF entry . A window should popup letting your choose for which query you want to set the alert.
f.e. the “B” here
Setup the time period for which the condition is checked by clicking the 2nd argument in the OF entry next to the query capital letter identifier .
A new window pops up letting you choose some default periods. Click one to confirm.
You can also type in a custom period. Hit enter to confirm.
f.e. the “1h” here
Leave the last argument in the OF entry to “now” to check the conditions for the given time period up till now.
Set an alert comparison type, by clicking the IS ABOVE box in blue . This alert comparison type can be altered to some default options:
- alert to trigger above a particular value by selecting
IS ABOVE - alert to trigger below a particular value by selecting
IS BELOW - alert to trigger when the value is inside a range by selecting
IS WITHIN RANGE - alert to trigger when the value is outside a range by selecting
IS OUTSIDE RANGE
Set the alert value to be compared to by filling in the entry next to the alert comparison type .
Finally, set the key value for the given time period to be compared to the alert value, by clicking next to the WHEN entry on the left.
Here different selectors and aggregators can be picked by clicking one of them in the window that pops up.
These are similar to the key value possibilities discussed in the Stat panel.
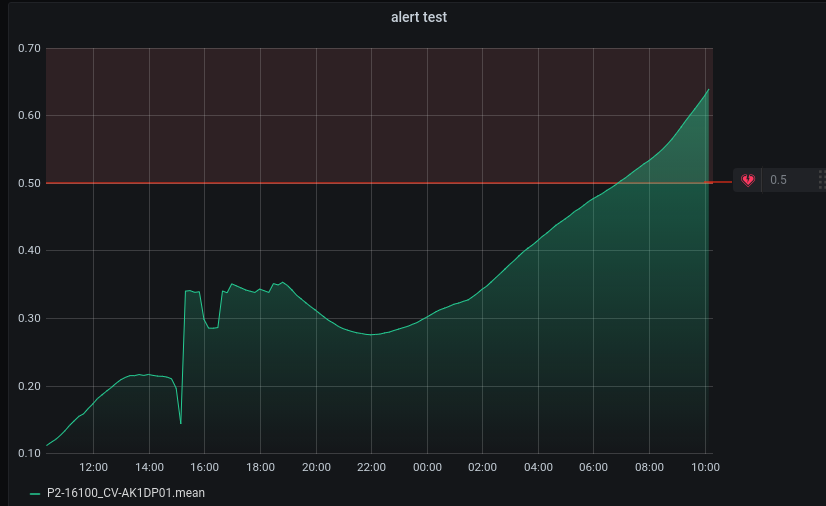
Note that a red region can appear on the graph (depending if the alert value is inside the y-axis range of the graph), indicating the region for which the alert will be triggered when the alert condition is met.
2.4 Add multiple alert conditions
It could be useful to set multiple alert conditions for a single alert, checking incoming data of multiple measurements at once.
Add an alert by clicking the Plus icon underneath the Conditions section and select the Query option in the window that pops up.
Once multiple conditions are available, they will all be checked before triggering the alert. Make sure only to keep the alert conditions that should be checked before triggering an alert.
2.5 Remove an alert condition
You can remove an alert condition by clicking the Waste bin icon next to an alert condition.
Make sure always to have one condition set before triggering the alert.
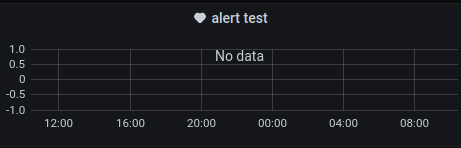
2.6 No data or empty data
You can choose to trigger the alert, independent of the alert condition, when no incoming data is present or all incoming data values are empty (null),
Therefore click the dropdown next to the SET STATE TO box in blue and select the Alerting state by clicking it.
Other options are:
- setting a specific alert state
No data - Keeping the last alert state when this occurs
Keep last state - setting the state to
OKwhen no incoming data is present
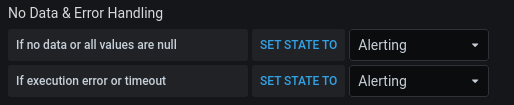
2.7 Other data errors
To handle a query timeout or another occurring error for the incoming data, an alert can be set in the same manner as with the No data or empty data alerting section above.
3. Alert notifications
After setting up a visual alert above, the alert will be visible on the panel in the dashboard. However, this means that a person should be manually monitoring the dashboard to see when an alert gets triggered.
For this reason, notifications can be automatically sent when an alerts gets triggered.
Therefore a notification channel needs to be set up and should be added to the alert for it to send notifications to the channel.
3.1 Setup a notification channel
Hover over the Bell icon in the main left navigation bar of grafana, followed by a click on Notification channels .
Click the Add channel button in blue to start adding a new notification channel for you alerts.
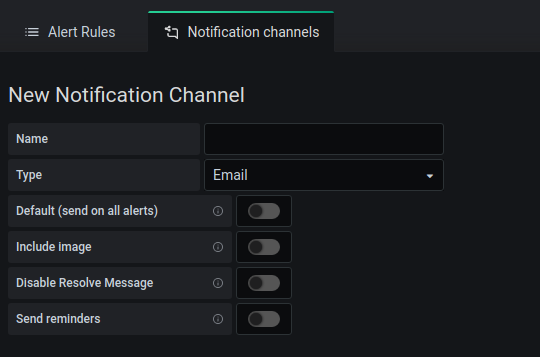
Channel name
Fill in the Name entry to give a name to the notification channel.
f.e. email Tom
Channel type
There are a lot of different channel types available for receiving alert notifications.
Most of them are out of the scope for this grafana reference.
Therefore only the most used channel type, the Email type, will be discussed.
Click the Type dropdown and select the Email option.
It is possible to setup a channel that receives grafana alerts via SMS via the custom webhook channel type. Although, this is more advanced and needs an extra implementation separate from grafana.
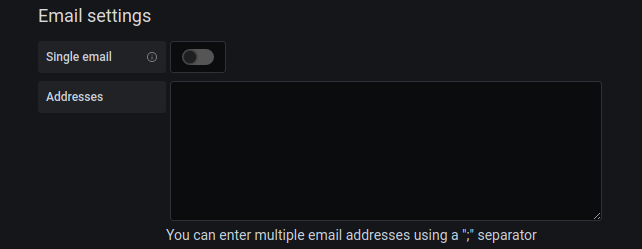
Give in the email addresses in the Addresses entry .
You can choose to send one email with all recipients included by enabling the Single email slider .
Else all recipients will receive a separate email.
Default channel
A default channel is a channel that is used to receive notifications from all alerts in grafana, no matter the dashboard the panel is located in.
It is not recommended to use this, since over the course of time alerts of unexpected sources will be received on the wrong channel that is was meant for.
Enable the Default slider to set the current channel as a default for all alerts.
Alert image
You can enable the sending of an image of the panel when an alert gets triggered, together with the notification, to the notification channel.
For this to be available, the Grafana image renderer plugin needs to be installed on the grafana server.
This plugin is currently not used very often.
Alert OK notification
By default a triggered alert will send 2 different notifications over the course of time.
The first one being the notifications for when the alert gets triggered, meaning the alert is in the state Alerting .
However, it is useful to receive another alert notification for once the incoming data stream is fixed, so that you are aware of the time when the issue was solved.
By default this setting is enabled.
Turn off this notification by enabling the Disable resolve message slider .
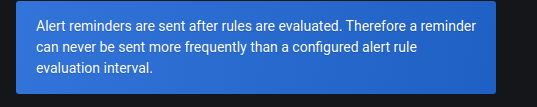
Alert reminders
You can set reminders on an alert, to get an additional notification when an alert was triggered after some time.
However, you do already receive an alert at the evaluation frequency configured in the alert itself.
This can be useful if the evaluation frequency is a bit larger, to get alert reminders more frequently.
f.e. an evaluation frequency of 6h and a reminder frequency of 1h
Enable the Send reminders slider to enable alert reminders and fill in the reminder frequency in the Send reminder every entry .
Test and save
At the bottom, do not forget to test and save the channel.
Click the Send test button to first test if the configured channel is working.
After checking the channel configured, save the channel configuration by clicking the Save button in blue .
3.2 Add a notification channel
After setting up the first notification channel, other channels can be added by going to Notification channels via the Bell icon in the main left navigation bar.
Click the New channel button in blue to add an extra notification channel.
3.3 Remove a notification channel
In the Notification channels ,click the red cross icon next to a notification channel, to remove a previously configured notification channel.
3.4 Connect notification channel to alert
Navigate to the panel with the configured alert and open the Alert tab .
Underneath the Notifications section , click the plus icon next to the Send to box .
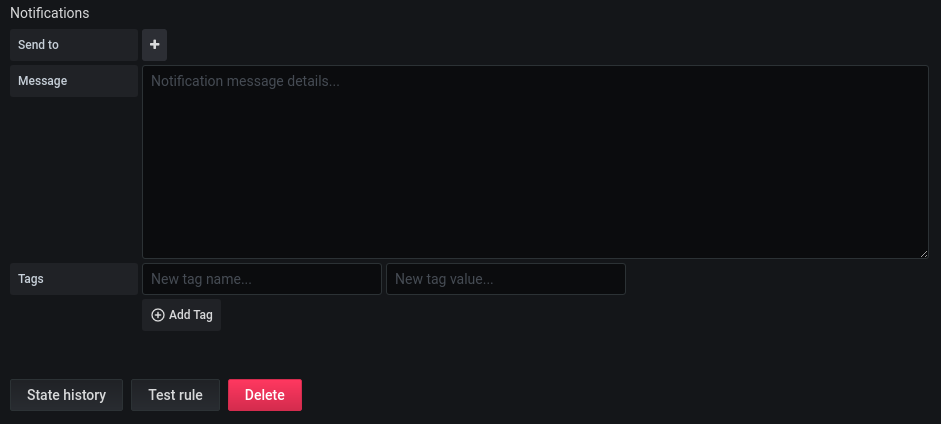
Add notification channel to alert
A window pops up holding the currently configured notification channels.
Click a channel to connect the alert to the channel, meaning when the alert gets triggered a notification will be sent to this channel.
Add multiple notification channels
To add multiple notification channels to the alert. execute the process above for adding one notification channel, multiple times.
Notification message
In the Empty entry next to the Message box a message can be set as notification content to be sent to the notification channel(s), when the alert gets triggered.
4. Overview of alerts
4.1 Alert rules
Hover over the Bell icon in the grafana main navigation bar on the left and click Alert rules in the popup window.
This gives you an overview of all configured alerts on all dashboards.
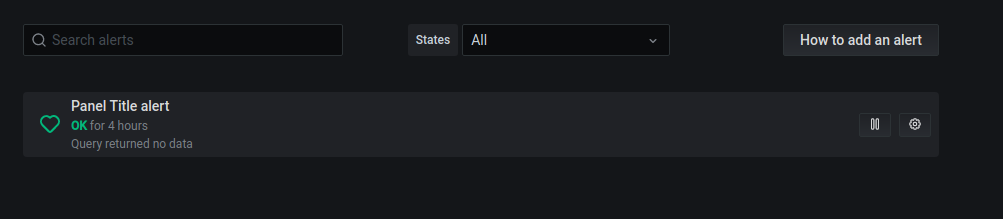
Search alerts
On the top left, you can search for alerts by filling in the Empty entry .
Filter alerts by state
Click the dropdown next to the States box to filter the alerts on a specific state.
Pause an alert
Pause an alert by clicking the pause icon on the right of an alert.
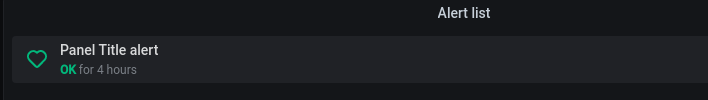
4.2 Alert list as panel
When adding a new panel to a dashboard, you can choose for the Alert list as visualization in the Visualization tab in the right pane.
5. Alert states
An alert can have different states, explained shortly below.
5.1 Paused
An alert that is in the Paused state, will not be triggered anymore.
This is useful when you want an alert to be temporary silent, but you do not want to remove it, since it could be needed again later on.
5.2 Pending
When initially setting up an alert, the alert state will be Pending .
This is visualized by the heart icon in white next to the panel title.
Depending on the evaluation frequency and the duration for which the condition are checked in the query, it can take some time before the alert gets into the OK state.
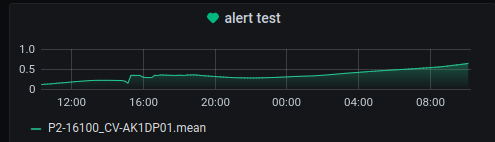
5.3 OK
The OK state for an alert, means that all data should be coming in correctly, based on the conditions that were set in the alert configuration.
This state is visualized by the heart icon in green next to the panel title.
5.4 Alerting
When the configured conditons for the alert are not met, the alert will be triggered and go into the Alerting state.
This state is visualized by the heart icon in red next to the panel title.
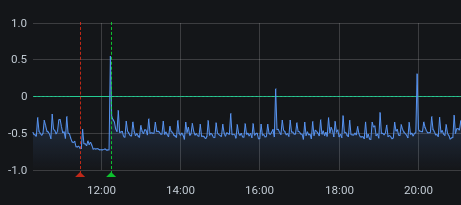
5.5 Alert state graph annotations
The alert states can also be seen as an annotation on the according panel.
The Dashed red line indicates the time when the alert was triggered and the alert state was Alerting .
The Dashed green line indicates the time when the issue was fixed and the alert went back to the OK state.