1. Make a dashboard
Click the plus icon in the left pane to make a new dashboard.
A dashboard is an ensemble of panels. In each panel, data can be displayed using a visualization like a graph, table, …
Panels can be arranged vertically, horizontally and can be resized.
Each panel is a separate entity, which is not influencing other panels.
2. Dashboard operations
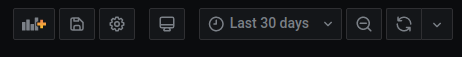
Once in a dashboard, in the top right, the dashboard operation icons can be found. With these buttons the main dashboard operations can be executed. Note that some of these icons are similar to the ones previously used.
Explore measurements - query data
2.1 Add an extra panel
Click the Chart plus icon to add a new panel to the dashboard. For a new dashboard one panel should be available by default (see the section: add a panel).
2.2 Saving a dashboard
To save your dashboard, click the Disk icon . A window should pop up, giving you the ability to save your current dashboard.
Before leaving a dashboard, make sure to save your changes first. Unsaved changes will be lost!
First time save
The first time you are saving a newly made dashboard, this window will pop up.
Give the dashboard a name in the Dashboard name entry . This is the name displayed on top of the dashboard and will be the name under which the dashboard is saved as well.
When the name of the dashboard is changed afterwards in the dashboard settings, also the name for which the dashboard is saved will be changed to the new name. In other words the name of the dashboard (displayed on top) and the dashboard name for which the dashboard is saved will always be the same.
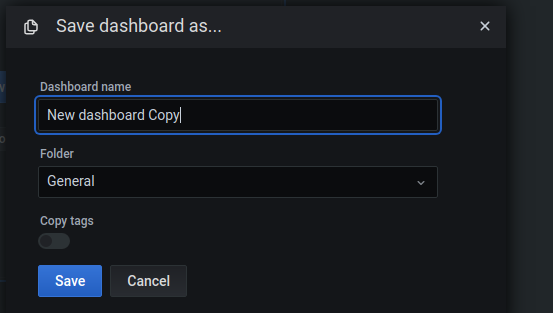
In the Folder dropdown a folder can be chosen under which the dashboard will be saved. By default there is a General folder available. Other folders can be made by using the Tiles icon in the main Left pane of Grafana and navigating to Manage .
By enabling the Copy tags slider the created tags in the dashboard settings will be saved as well with the dashboard. This is useful to be able to search dashboard by their tags, instead of by the dashboard name.
Press the Save button in blue to save the dashboard.
Default save
After the first save of a dashboard, the window popup after pressing the Disk icon , will look different than for the first save of the dashboard.
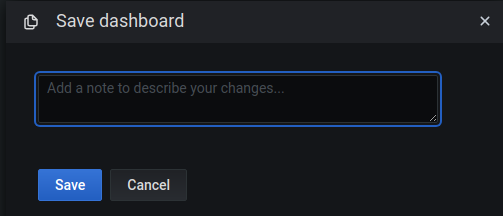
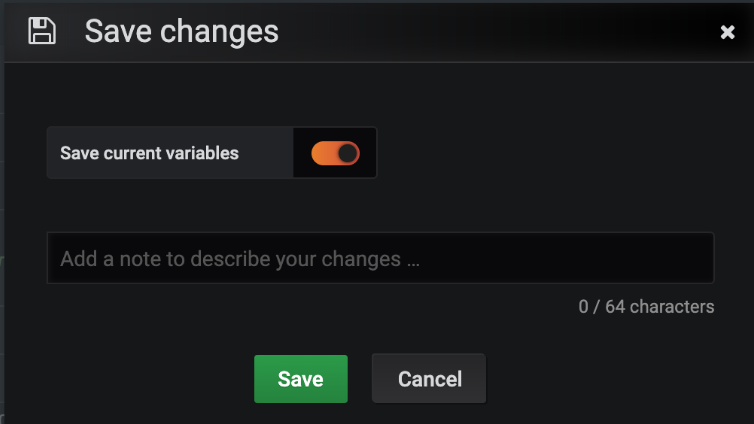
For a default save, the window popup will show a Note entry to fill in a note about the things you’ve changed to the dashboard before actually saving. This note can be left blank, but it is good practice to add a note before committing the save with the Save button in blue .
The note that you leave in this change window is part of the dashboard version control. embedded in grafana. When adding this note, later on you will be able to view a list of all changes done to a dashboard, accompanied with this note for each change. Then, it will be way more convenient to know what actually changed between dashboard versions when notes are present per change.
This comes in useful when trying to revert to a previous dashboard version if something went wrong and has been saved already!
Manage dashboards and access control
Save time range
A dashboard always has a default time range for all users that access the dashboard. This is the initial time range when opening the dashboard. It is very useful to set this time range accordingly to the most fitting time range for the panels on your dashboard.
This can be done by changing the time range in the dashboard to the appropriate time window in the top right.
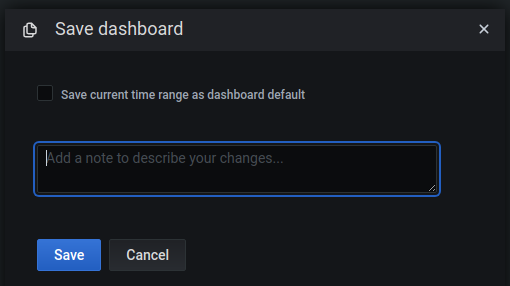
When the time range changed vs the default time range for the dashboard (which was automatically selected when saving the dashboard for the first time), the Save current time range as dashboard default checkbox will appear when saving the dashboard.
Make sure to check this one before clicking the Save button in blue .
Next time any user opens up the dashboard, the time range will be the one that you saved earlier for this dashboard.
Save dashboard variables
Like for saving the time range as a default for the dashboard, the same can be done for saving the current dashboard variable selected as the dashboard default variable selected.
You should have a dashboard variable setup and a selection of a particular value for the dashboard variable should be made before the Save current variables checkbox or slider when saving the dashboard.
Save as (dashboard copy)
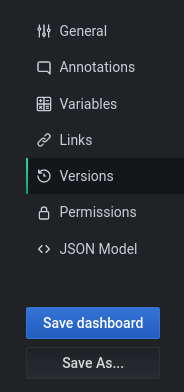
Click the Gear icon in the top right to go to the dashboard settings.
You can explicitly save a dashboard using the Save as... button in the dashboard settings.
In reality this comes down to taking a hard copy of a dashboard (no reference, meaning changes in one copy won’t effect the other copy).
This is useful for trial and error of new functionality for a dashboard used in production.
After clicking, a window pops up, exactly the same as the one when saving your dashboard for the first time.
2.3 Cycle view mode (monitor)
To initiate the Cycle view mode , click the Monitor icon . This is used to display the dashboard onto a monitor, removing all unnecessary bloat around the dashboard to make it optimal for being exposed to any kind of people viewing the monitor within your site.
Intermediate cycle view
After the first click on the Monitor icon , some bloat is removed from the dashboard like the main left pane and the title bar on top.
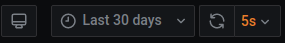
Also the operation icons in the top right are reduced to these ones:
Full cycle view
When clicking the Monitor icon a second time, all bloat is removed from the dashboard. This is the most minimalistic view of the dashboard to be displayed on a monitor.
2.4 Enter dashboard settings
To go to the dashboard settings click the Gear icon .
2.5 Dashboard time range
As discussed earlier, the time range can be set in the top right by pressing the dropdown arrow next to the clock icon .
When changing the time range for a dashboard, all panels will be taken over this time range to display their queried data. You can not use different time ranges for different panels in the dashboard and see both panels at the same time.
You can however, open up a panel and adjust the time range, to see the queried data for this time range for only the opened panel. When going back to the dashboard, the time range of the previously opened panel will be taken as the time range for the dashboard, adjusting all other panels again to the selected time range.
3. Dashboard settings
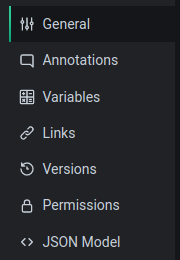
Once in the dashboard settings, multiple tabs can be clicked.
3.1 Name, description and tags
Click the General tab to get into the general dashboard settings .
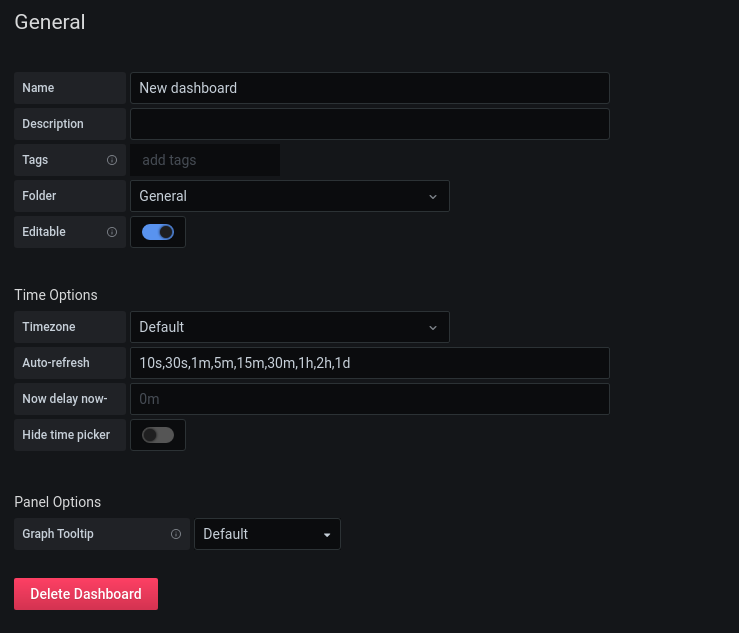
Set the name of the dashboard by filling in the Name entry.
This entry can be used after saving of the dashboard te rename a dashboard. When renaming the dashboard the name for which the dashboard was saved will be changing to the new name as well.
Set a short dashboard description by filling in the Description entry .
3.2 Tags
Tags are used to logically group dashboards together. This is useful when searching for related dashboards.
You can add tags to a dashboard by filling in the Tags entry . Type a name for a tag in the entry, then click outside the entry for the tag to be generated.
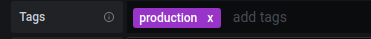
More tags can be added in the same way as the first tag.
3.3 Dashboard location
You can add the dashboard to an existing folder by clicking the Folder dropdown and selecting the desired folder.
The managing of dashboards and folders is discussed here:
3.4 Editability
Using the Editable slider , you can make the dashboard editable or non editable. Can be useful once a dashboard is setup, to make it non-editable here. To be able to edit again, the slider should be enabled first.
3.5 Time options
Set the timezone per dashboard via the Timezone dropdown . Could be useful if you want a specific timezone for a particular dashboard.
Manage the options in the auto refresh dropdown in the dashboard by adding or removing options in the Auto-refresh entry , separating options with a comma.
Hide the time picker (the time range in the top right of the dashboard), by enabling the Hide time picker slider .
3.6 Share the tooltip over panels
This is a frequently used functionality for a dashboard in grafana.
By setting the Graph tooltip dropdown to Shared tooltip , the tooltip (value and crosshair) will be shared over different panels in the dashboard. This means that whenever you are pointing at a particular timestamp in a graph in the dashboard, which enables the tooltip for that graph. for all other graphs in the dashboard the tooltip will be displayed for the same timestamp.
Thus, letting you easily compare values for the same timestamp over different graphs
By setting the Graph tooltip dropdown to Shared crosshair , only the crosshair (most of the time a vertical line) will be shared over different graphs in the same dashboard.
3.7 Deleting a dashboard
Delete a dashboard by clicking on the Delete dashboard button in red . This will popup a window to confirm the delete before actually proceeding to delete the current dashboard.
3.8 Variable settings
Click the Variables tab to get into the dashboard variables settings.
About dashboard variables
Dashboard variables can be useful to f.e. indicate different production lines in a dashboard. By switching the dashboard variable to another production line, all the panels in the dashboard can be referencing to that other production line. This makes the dashboard generic for different production lines.
In general, the Dashboard variables are used frequently to automate dashboards in some way. Making use of a predefined set of values to be able to switch between and letting the dashboard follow on the value of the dashboard variable.
Dashboard variables can also be fetched from a data source, so that they are automatically updated, when new data is available.
Dashboard variables are highly customizable, giving the opportunity to use countless possibilities.
Add a dashboard variable
Click the Add variable button in blue to start adding a dashboard variable.
There are multiple possibilities to add a dashboard variable. These can be explored by clicking the Type dropdown .
The most frequently used types are:
- the
Customdashboard variable to add a predefined set of values as a variable - the
Querydashboard variable to query a set of values from a data source, with an optional regular expression.
For simplicity, only the Custom dashboard variable will be discussed in the scope of this documentation.
Custom dashboard variable
As explained above, with this type of dashboard variable a predefined set of values can be given for a variable.
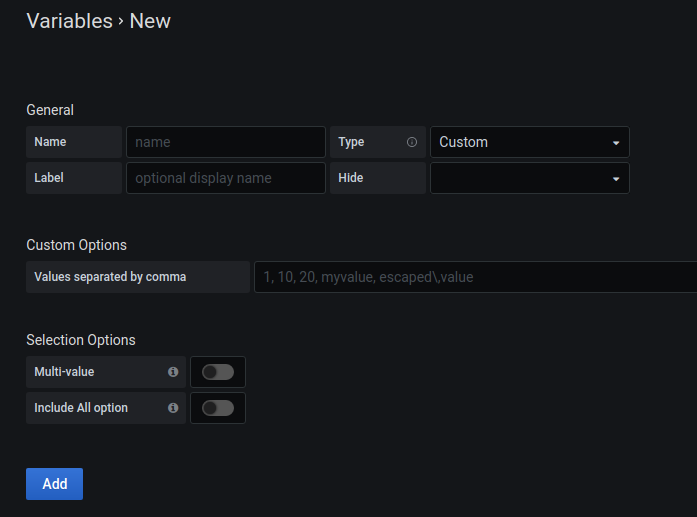
Make sure the Type dropdown is on Custom .
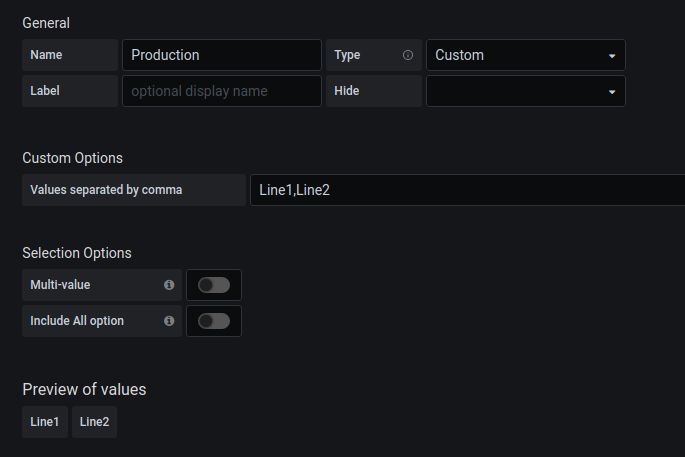
Name the variable with the Name entry.
Optionally, give a display name or a label for the variable using the Label entry .
Important to remember is to checkout the Hide dropdown .
With this, you are able to hide the display name for the variable in the dashboard by selecting Hide label . Like this, the variable values will be visible in the dashboard to be selected, but the display name of the variable will disappear.
Hiding the complete dashboard variable, can be done by selecting the Hide variable in the Hide dropdown. This is not very useful at first, since after hiding you are unable to select the values from the dashboard variable in the dashboard itself, making you unable to use the dashboard variable.
Hiding dashboard variables is only useful, after your dashboard is completely setup and the value of your dashboard variable shouldn’t change anymore.
Adding the set of values for your variable can be done by filling in the Values separated by comma entry . Make sure to add a comma between the different values.
You can enable the Multi-value slider to allow selecting multiple values at once.
Enable the Include All option to add a value All that selects all the values from the dashboard variable at once.
A Preview of the values for your dashboard variable can be seen at the bottom.
Click the Add button in blue for the dashboard variables to be added to the dashboard.

After adding your first dashboard variable, you can duplicate the previous dashboard variable by clicking the Duplicate button on the right of a variable.
Delete a dashboard variable by clicking the Cross button in red on the right of a variable.
Note that the Variable Definition contains an overview of the values in your dashboard variable.
Add a new variable by clicking the New button in blue in the top right.
Switching dashboard variable values
Go to the dashboard to see the dashboard variable you’ve created earlier.
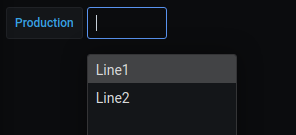
On top the dashboard variable should be visible. Click on the Value entry to select a value for the dashboard variable to be used.
Using a dashboard variable in a panel
To use a dashboard variable in a panel on your dashboard, you need to indicate the name of the dashboard variable between placeholders:
|
|
Replace “variable-name” with the name of your dashboard variable.
F.e. a dashboard variable can be used in the measurement name to query data from a certain measurement based on the value in the dashboard variable.
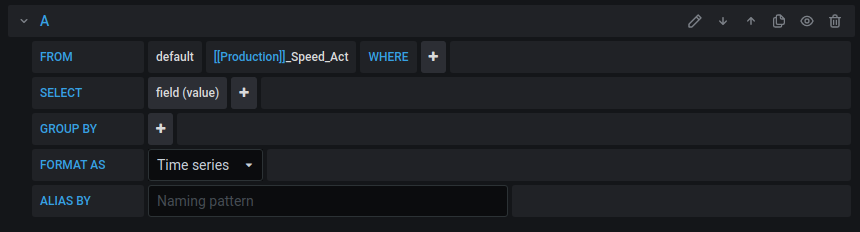
If the variable gets recognized, it will be colored (here in blue). The dashboard variable in the measurement name will be replaced by the selected value for the dashboard variable in the dashboard (“Line1” or “Line2”).
4. Dashboard panel
In the default dashboard, a default panel will be already available looking like this:
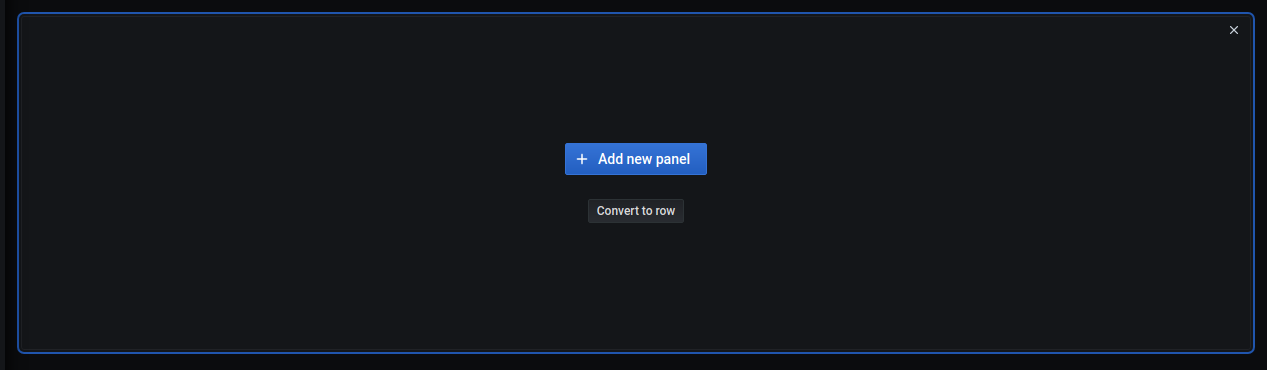
To add the default panel and enter it, click the Add new panel in blue.
4.1 Apply panel changes to dashboard
After you made changes to a panel, you need to apply the changes for them to take effect on the dashboard.
This can be done by clicking the Apply button in blue on the top right.
For a panel, If you would use the Return to dashboard arrow in the top left, the changes are automatically applied on the dashboard.
This is different for saving changes of the dashboard, before leaving the dashboard. There you NEED to save your changes before leaving the dashboard.
4.2 Dashboard operations from within panel
A bit confusing, is that when you are inside a panel, the buttons on the top right are buttons that operate on the dashboard.
To save the dashboard from within the panel, click the Save button . A menu pops up for you to save your dashboard (see save a dashboard).
To discard the changes you did on the panel for your dashboard, click the Discard button .
To go to the dashboard settings, click the gear icon .
4.3 Panel query editor
In the panel, the query editor can be seen at the bottom left. The panel query editor is similar as discussed earlier.
Explore measurements - query data
Although some extra icons appear here to be used.
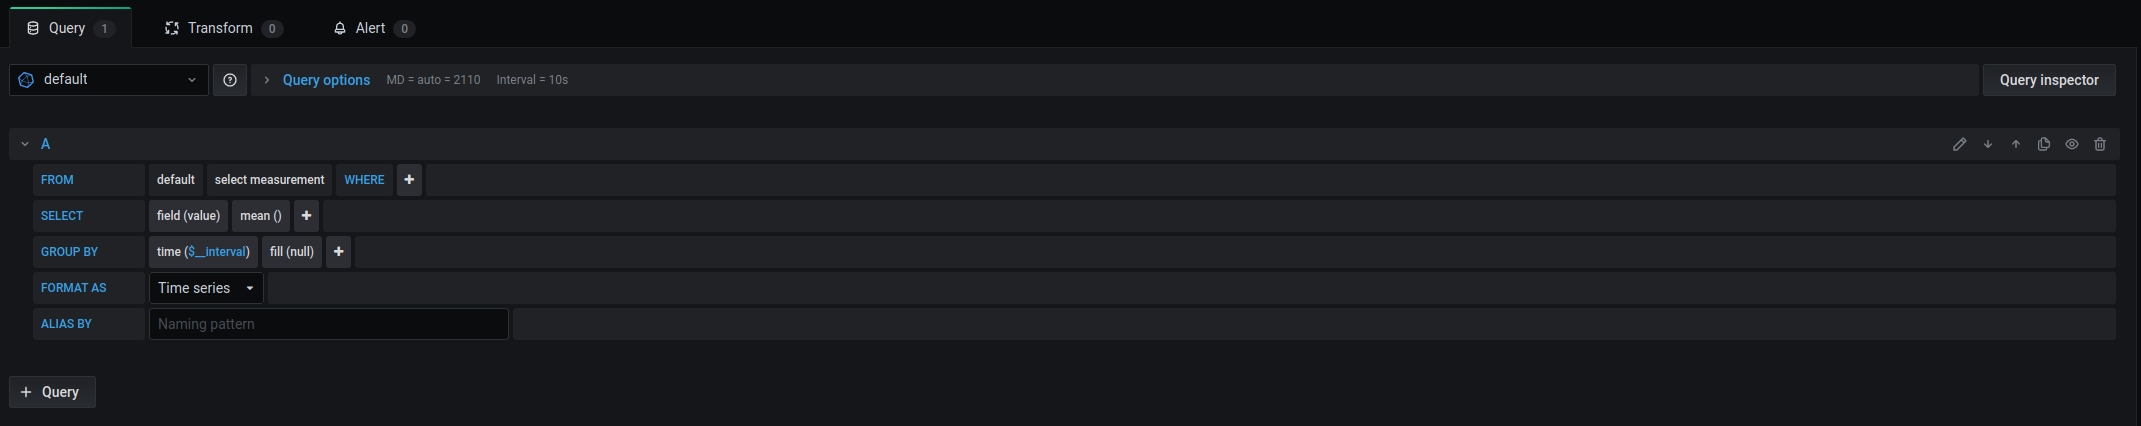
- The queries are identified with a letter, the first is identified with an
A, and so on. - With the
files iconon the right in the panel query editor view, a query can be copied, to easily setup a new query. - The
eye iconon the right in the panel query editor view, lets you enable or disable a query on your panel. - You can move queries up and down in the panel query editor view, by using the
up arrowand thedown arrowon the right.
4.4 View the queried data
On the upper left side in a panel, the queried data will be displayed. The queried data is by default displayed as a graph. But this can be changed in the panel configuration later on.
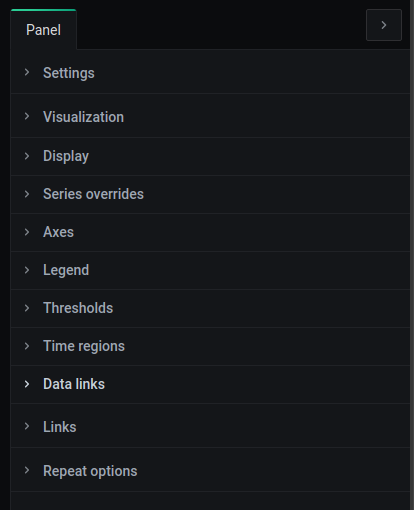
4.5 Panel configuration
In the panel right pane, the panel can be configured.
Panel title and description
Click on the Settings tab to expand the Panel settings .
In the Panel title entry, a title for the panel can be given, which will be displayed on top of the panel in the dashboard.
In the Panel description entry, a panel description can be given.
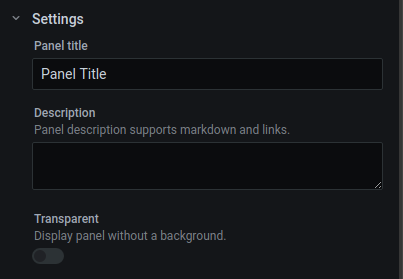
Panel transparency
You can make the panel visualization transparent in your dashboard by enabling the Transparent slider .
Panel visualization
In the Panel visualization tab , the type of panel can be chosen. The 4 most uses types are the Graph, Stat, Gauge and the Table .
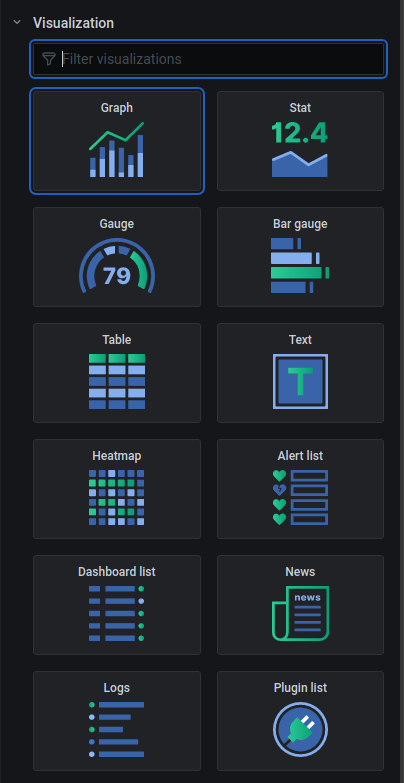
By default a Graph type is selected. Click on another type to select it accordingly.
In the following subpages, the most frequent panel types are explained:
4.6 Panel operations
Return to the dashboard itself. From in the dashboard, different panel operations can be done.
Click the Panel title of a dashboard panel to popup some operations.
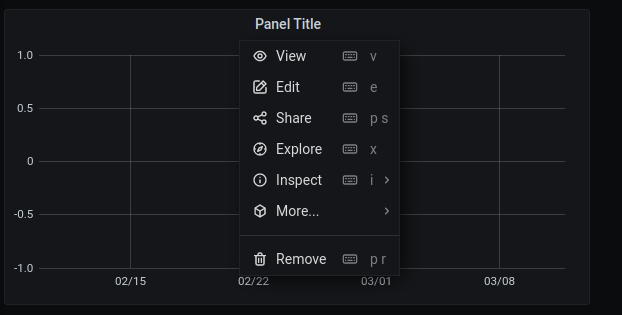
Note that next to these operations, shortkeys are shown. Press the shortkey while hovering over a panel to execute the according panel operation.
View a panel full screen
To view a panel in full screen mode, click the View buttton in the popup window. Now the panel is occupying the whole screen of the dashboard. Undo this operation by clicking the Return arrow in the top left.
Edit a panel
Click the Edit button in the popup window to edit a panel. This is a frequently used operation.
Inspect a panel
Click on the Inspect button to inspect the panel. This is useful to get more details about the data passing through, query statistics or to get the panel configuration in a JSON format. It is used mainly for debugging purposes.
Duplicate a panel
To duplicate a panel with the exact same settings on your dashboard, click the More button followed by clicking on the Duplicate button .
This is very useful when building up your dashboard with panels. Or when you want to make a variation in functionality to a currently existing panel.
Copy a panel (through dashboards)
To copy a panel, click the More button followed by the Copy button . This will copy the current panel.
To paste the panel in the current dashboard, click the Chart plus icon on top (a dashboard operation for adding a panel). This will popup a new panel:
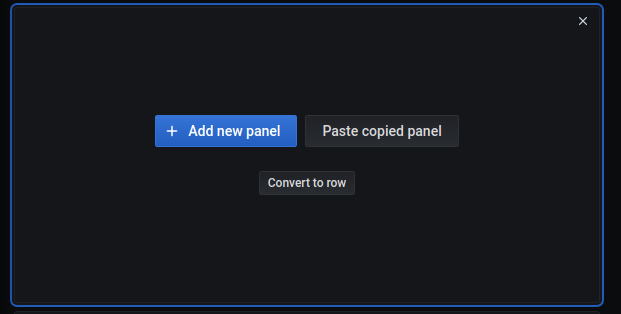
Click the Paste copied panel button to replicate the panel in the current dashboard (similar as the duplicate operation).
However in the same manner, you are able to add a copied panel into another dashboard.
Copy the panel likewise, exit the current dashboard (save the changes you made) and go into a new dashboard to add a new panel and paste the copied panel from the previous dashboard.
Remove a panel
To remove a panel from the dashboard, click the Remove button in the window popup.
Resize a panel
To resize a panel, click and drag the bottom right corner of a panel.
By default, panels are positioned as high as possible, and next to each other.