1. About grafana data sources
In the first place, grafana is a front-end software tool, meaning it’s primary purpose is the visualization of data and next to that adding support for some minor analytics via flux or other plugins.
Therefore grafana needs to have access to external data sources to be able to connect to a database and fetch data from it. Thus, grafana is not the location where the data gets stored.
As a result there is a need to setup a data source before being able to fetch any data via a query.
2. Influx data source
Further, a short explanation is provided for setting up an influx data source in grafana, since this is the data source that occurs most frequently up till now in the Factry stack.
2.1 Query methods
For an influx data source, data can be queried in 2 different ways:
- via an Influx query language query (
InfluxQL) → the default query method - via a
fluxquery → more advanced query method using the dedicated influx query language
Both of the query methods require a separate data source to be setup before being able to fetch data with the according query language.
2.2 Add an influx data source
As explained above, an influx data source uses by default the Influx query language.
To start setting up a new data source, the current user has to be an admin user.
Hover over the Gear icon in the grafana main navigation bar on the left and click on Data sources .
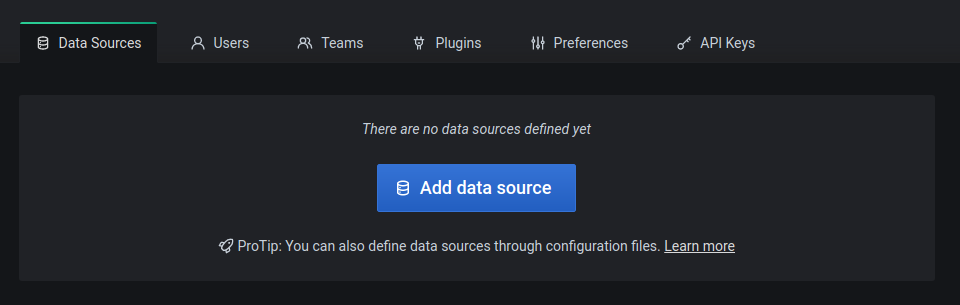
Click the Add data source button in blue to start adding a new data source.
In a default scenario, the most data sources will be already configured by Factry after installing the historian.
Search for the InfluxDB data source (can type “influx” in the top left entry) and click it.
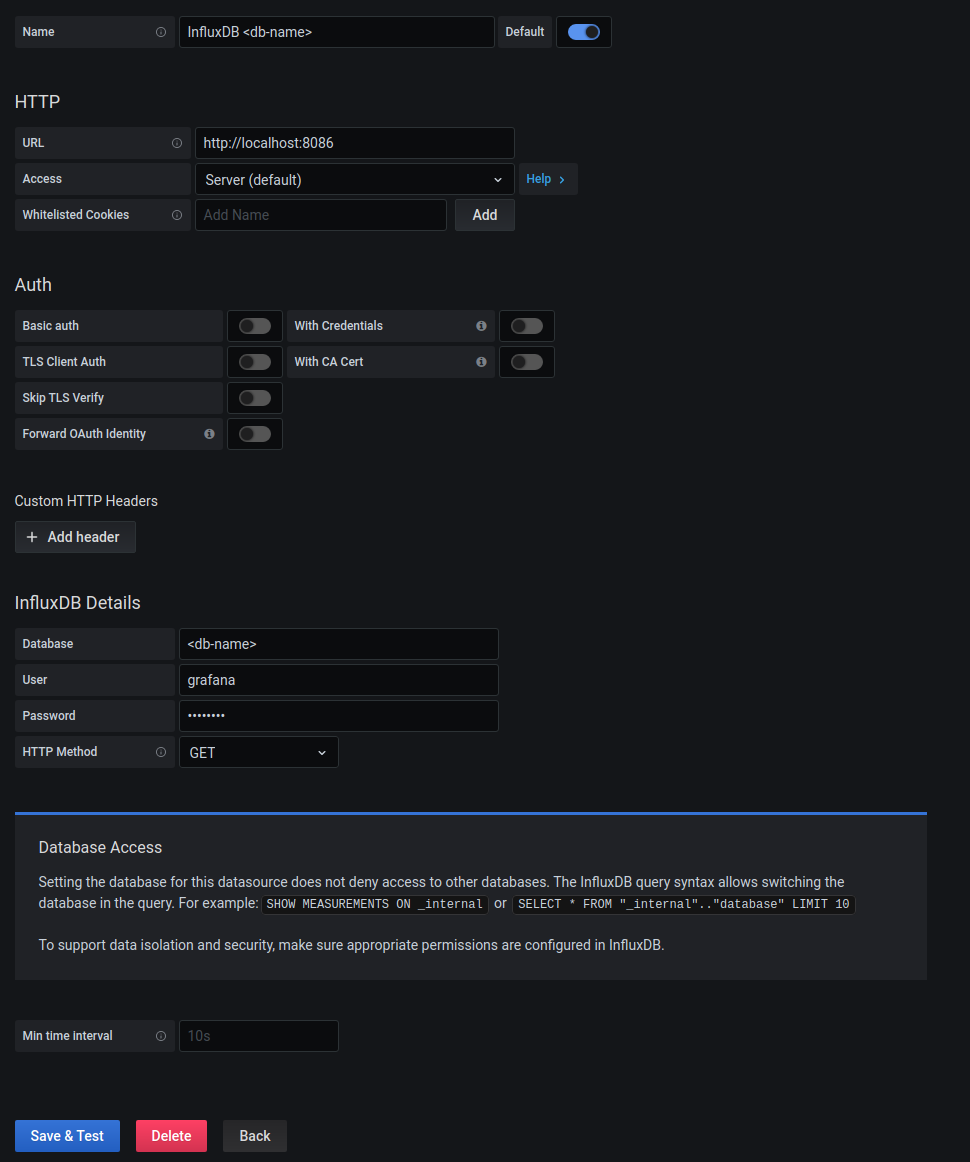
In the Name entry on top, give in an appropriate name for the data source as shown above (replace
In the Url entry add the address of the historian server, prefixed by http:// amd suffixed by the influx port :8086 . In most cases grafana and influx are running on the same server and then you can fill in [localhost](http://localhost) as the address, in the other case take the ip address of the historian server.
Do not enable the Basic auth slider underneath the Auth section, since this is superfluous for the historian.
Credentials for influx are filled in underneath the InfluxDB details section.
In the InfluxDB details section, give in the correct database name as is in influx, in the Database entry.
In the User entry fill in the read-only user name for influx. Most of the time this will be grafana .
In the Password entry fill in the password for this influx user.
In the HTTP Method dropdown pick the Get option.
Save the data source, by clicking the Save & Test button at the bottom.
If the data source is configured correctly, a green popup will appear indicating the number of buckets available, which is indicating the number of databases inside influx.
If a basic authenticating window appears in your browser after saving the data source, then the influx credentials are faulty.
2.3 default data source
For each grafana organization a default data source can be set.
Checkout the image for adding an influx data source above. In the top right enable the Default slider for this data source to be selected by default when opening the query editor in a dashboard.