1. Exploring measurements
Purpose: Exploring measurements is useful to quickly check the collected data from a measurement, without having to setup a dashboard. This is used frequently to check if data is coming in for a certain measurement and how the data looks like.
Click the Explore button in the grafana main navigation bar on the left.
2. Data source
In the top left, the Data source can be seen from which the data will be fetched.

Before being able to effectively query data, the according data source needs to be selected in the Data source dropdown.
These data sources should have been set up before, via the Gear icon in the grafana main left navigation bar and clicking Data sources .
Once the data sources are configured in there, they should become available to be selected in the query editor.
Here the data source is:
|
|
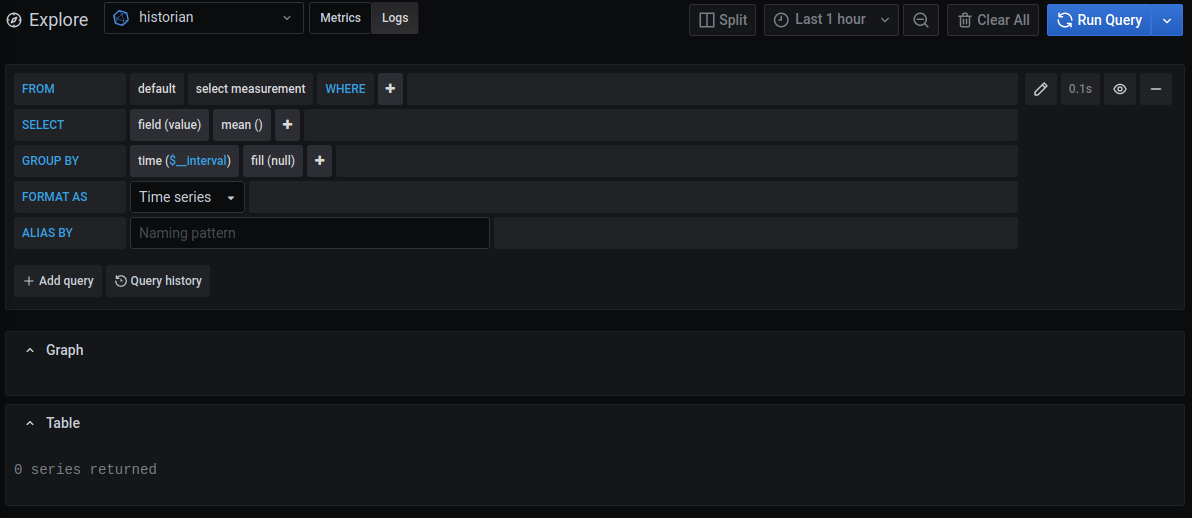
3. Query
In the query editor in the middle left of the screen, a query can be setup, giving you the ability to fetch data from the data source collected. The query holds some statements to be filled in.
3.1 From
Lets you set:
- the
retention policy(keep on default). This is the retention policy used by influx, no need to change this. - the
measurement, which is themeasurement namecollected in the historian. You can click and select an existing measurement name, or type and search for a measurement (only the first 100 measurements available are shown). This will only list the measurements available in theselected data sourceabove.
3.2 Where
Lets you set a condition for a tag to hold a particular value. Click on the plus icon to add a condition. Click on the added tag and click remove, to remove it again. (same to remove other added statements)
The Where statement can also be used to set a condition on the value from the measurement coming in.
3.3 Select
Lets you select a field in the current measurement. By default this is the value field.
For a boolean there is f.e. also a value_num field, holding 1 for true and 0 for false.
On the right of the select, you can click on the plus icon to add:
- a
selectorto take thefirst,last,max,min, … of a field from your measurement. - an
aggregatorto take thecount,distinctvalues,mean,median,sum, …
Most of the times, this is used in combination with aGROUP BYstatement. To have an aggregate per time period f.e. the avg per hour.
If noGroup bystatement is used, the aggregate will result into only one value for the whole time range f.e. the avg for the selected time range. - a
mathstatement to do calculations on a field of your measurement. Click on the calculation in the math statement to type a custom math statement.
*to multiply
/to divide
+to sum
-to subtract
With the math statement, only math operations can be done with a fixed number. To do calculations between measurements, you need to use a transformation.
- an
aliasfor your measurement. Click on the alias to type a custom alias for the measurement. The alias will then be the display name of the measurement. - another
value field, next to the first value field.
3.4 Group by
The group by statement groups the fetched data by the time period given.
You can group the data by:
timeto take an aggregate (seeSELECT) over the given time period. Click on the interval to specify a time period.
Time periods can be given assfor secondsmfor minuteshfor hours
The time period $__interval is automatically calculated by Grafana. It is an interval to group by time in queries to optimize visualization when there are more data points than can be shown on a graph. Besides the visualization advantage, queries can be made more efficient by grouping data by a larger interval.
No months or years can be given here, since these are not always the exact same amount of time, which is a must to group your data.
tagto group the data according to a particular tag.
By default the group by statement is set, to reduce the load of a query for longer time ranges. Since data can be collected each few seconds, taking a large time range can take some time to process. Therefore by grouping, the time to process the query can be reduced .
3.5 Format as
The fetched data can be formatted as
- a
time seriesdisplaying the data in a graph (does not work so well for string values). This is the native format of the underlying influx database. - a
tabledisplaying the data in a table with the timestamp and the field value per record. This gives a nice overview of the raw data in a more manageable way to verify data manually.
3.6 Alias by
Type in an alias for the measurement name, which was used in the query editor, which will result in the given name being displayed in the visualization.
4. Add or remove a query
4.1 add query
Mulltiple measurements can be viewed simultaneously when adding another query by clicking the plus icon add query on the bottom of the query editor. This opens up another default query to be adjusted.
4.2 remove query
To remove a query, click the minus icon on the right side of the query editor. This is only possible when multiple queries are present.
5. Custom query
The clickable UI query editor, is very handy to build up a query fast, but it lacks in functionality compared to writing a custom query.
To write a custom query, click the pen icon in the query editor, to be able to input a custom query. For a default data source this is using the Influx query language (InfluxQL).
Note that, when switching from the clickable query editor to a custom query, that the current query is being converted to a custom format. This could come in useful, when needing to build up a custom query without remembering the exact syntax.
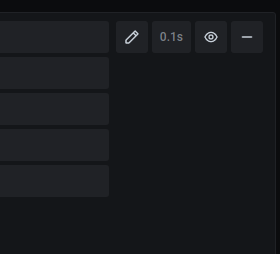
6. Run query
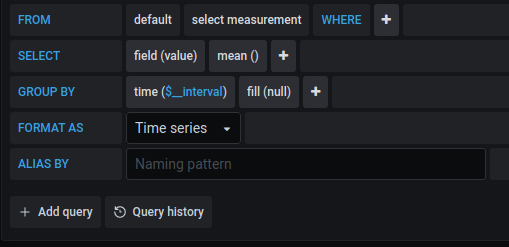
To run a query and get some run options, checkout the top right of the query editor.
To execute a query, click the circling arrows blue icon .
6.1 Auto refresh query
Click the dropdown arrow next to the circling arrows blue icon to expand the possible refresh periods for the query to be executed. When on 5 seconds, the query will be executed each 5 seconds.
Beware that for heavy load queries, the execute time can be more than a few seconds. If the refresh period is short, the query will loop over and over again without being fully executed.
7. Clear query
On the top right, the waste bin icon, clears all the queries on click. Except for the first query.
8. Time range
The queried data should be given a time range to operate on. This is probably the most used function in grafana, so be aware to use this appropriately.
The time range can be found on top in the query editor, f.e. here:
|
|
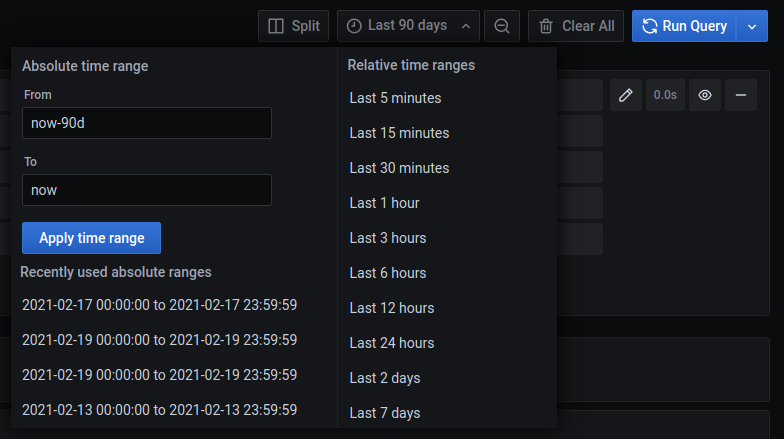
Click on the dropdown arrow next to the clock icon .
- On the left a custom time range can be set as time range by using the
FromandToentries. - On the right a list of
predefined time rangesis available.
By clicking on the From or To entry, a calendar is being displayed, letting you pick a day for both entries. First click the From entry, followed by the desired start date. Then click the To entry, followed by the desired stop date.
Also a time range can be selected for both entries by clicking and dragging the mouse.
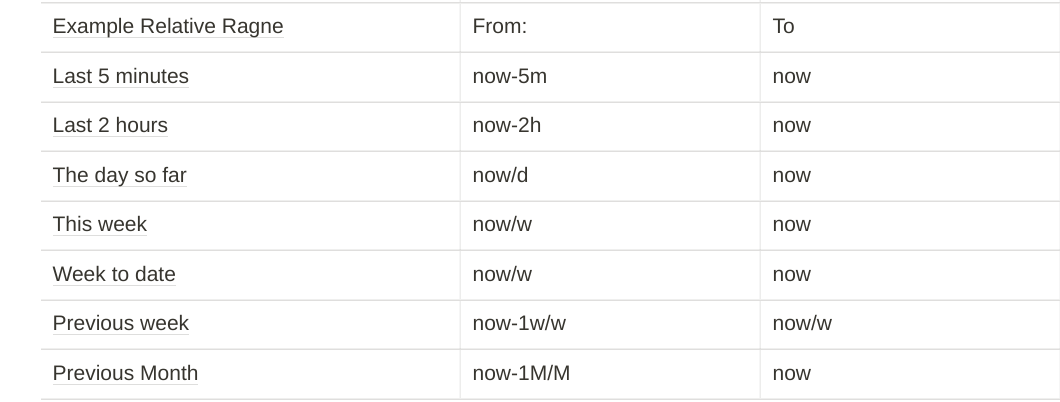
8.1 Relative time range
Relative time ranges, are determined compared to the current time, These are convenient in use, by using the predefined ranges like last 3 days or by indicating now - 3d in the From entry and setting the To entry to now.
These can be adjusted by:
sfor secondsmfor minuteshfor hoursMfor monthsyfor years
8.2 Absolute time range
Absolute time range can be set by giving a timestamp in the From and To entries, having this format:
|
|
8.3 Zoom out time window
On top of the query editor, the magnifier minus icon zooms out the time window to a time range chosen by Grafana (not so convenient).
8.4 Return to previous time window
To return to a previously used time window, use the return keys of your browser (could be that you need to click multiple times).