Measurement lifecycle
After creation of a measurement, the collector will start collecting data (make sure the collector is configured ).

Status Active
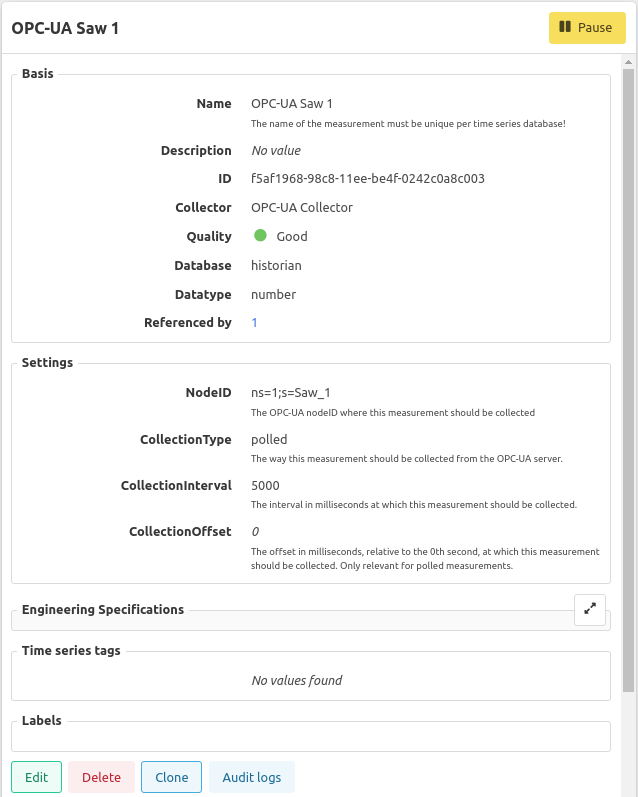
Once the measurement has been picked up by the collector, the measurement status will be Active and the measurement quality will be indicated.
Status Paused
The data collection for one measurement can be temporarily stopped by pausing the measurement. The measurement status will be Paused, until the data collection for this measurement is manually resumed.
Status Deleted
If you no longer need a measurement, you can delete it in the measurement detail view. After deletion, a measurement is not visible anymore and is given a status Deleted. Deleted measurements can only be restored using the bulk import functionality, overwriting the measurement with the same name and database and optionally differing measurement settings.
Status Discovered
Certain collectors have the capability to automatically discover measurements. Discovered measurements are not collecting data. A discovered measurement can be promoted to status Active by filling in the Database field (if it is not yet filled in) and optionally changing the measurement name.
Discovered measurements can be deleted, but it is always possible that the deleted measurement can be rediscovered.
Measurement quality
The quality of a measurement can be either Good or a variant of Bad.
Quality Good
When properly configured, the measurement quality will be indicated as Good. With this quality, the measurement is collecting data points.
Quality Bad
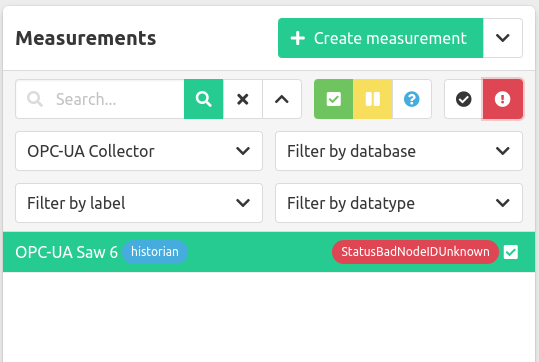
Indicating a Bad quality, the measurement is most likely wrongly configured and thus the measurement is not collecting any data points. A status message will be displayed as the measurement quality (f.e. BadInvalidDataType), which should guide you in helping to resolve the issue.
The measurement quality is derived from the the status code given by the industrial protocol in use.
Quality filter
To get an overview of measurements with a Bad quality, you can toggle a filter (the red exclamation mark icon) highlighting only Bad quality measurements.

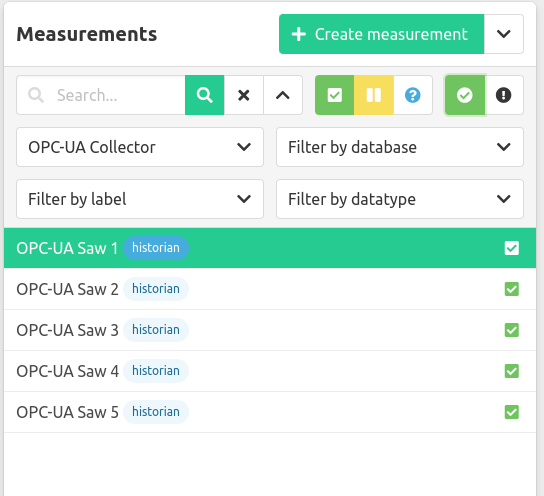
To only show Good quality measurements, you can toggle the filter with the checkmark icon.

Quality history
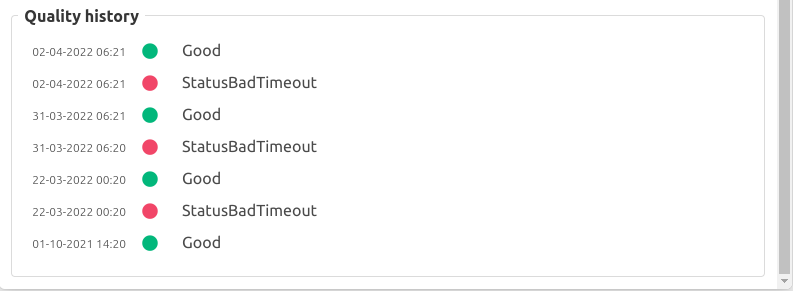
By default, the current measurement quality is indicated for every measurement that is in an active state. However, underneath the measurement detail view a history of the measurement quality is shown.
The measurement quality history shows the last 100 changes of the measurement quality.

Status of data points
Each data point receives a Status tag describing the quality of that particular data point from the measurement. This reflects the actual quality of the measurement at that point in time. A data point can f.e. have a Status tag indicating Good, BadInvalidDatatype, BadTimeOut, …
As an end user, querying for the Status tag in Grafana can be a valuable addition to verify the quality of the requested data points before performing any trending/calculations/analytics.
References
Measurements are used in a lot of places, you can keep track where and how many times a measurement is referenced to in its detail view. By clicking on the number a modal opens with all the calculations, event (property) configurations, event properties, or asset properties a measurement is referenced.
Clicking the reference will take you to that screen in the frontend.
